PublicInvest Research
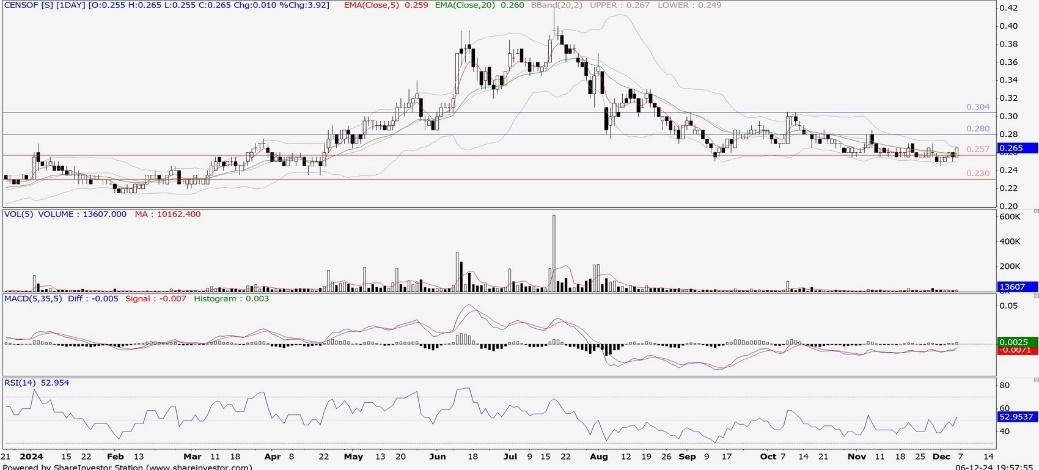
TECHNICAL BUY: CENSOF (5195)
PublicInvest
Publish date: Mon, 09 Dec 2024, 09:13 AM

| Key Technical Analysis | |||
| Last closing price: RM0.265 | |||
| Support Level | Share Price | Resistance Level | Share Price |
| 1st Support | 0.255 | 1st Resistance | 0.280 |
| 2nd Support | 0.245 | 2nd Resistance | 0.295 |
| 3rd Support | 0.230 | 3rd Resistance | 0.305 |
Description
CENSOF was established in 2008 as a technology holdings company specialising in financial management software solutions.
Fundamentals
The Group focuses on meeting the growing digitalisation needs of public and private sectors, as well as tapping into e-invoicing opportunities.
| Key Financial Data | |||
| Growth / Ratio | FY22 | FY23 | FY24 |
| Revenue growth (%) | 25.83 | -6.78 | -1.18 |
| Normalised net income growth (%) | -32.36 | -67.92 | -25.64 |
| Return on equity (%) | 19.69 | 5.84 | 4.36 |
| Return on asset (%) | 15.39 | 4.58 | 3.39 |
| Price earnings ratio (x) | 8.96 | 23.36 | 32.50 |
| Price to book ratio (x) | 1.65 | 1.36 | 1.41 |
| Debt to equity ratio (%) | 2.70 | 2.69 | 2.54 |
Source: PublicInvest Research - 9 Dec 2024
Related Stocks
| Chart | Stock Name | Last | Change | Volume |
|---|
Market Buzz
More articles on PublicInvest Research
Discussions
Be the first to like this. Showing 0 of 0 comments


