PublicInvest Research
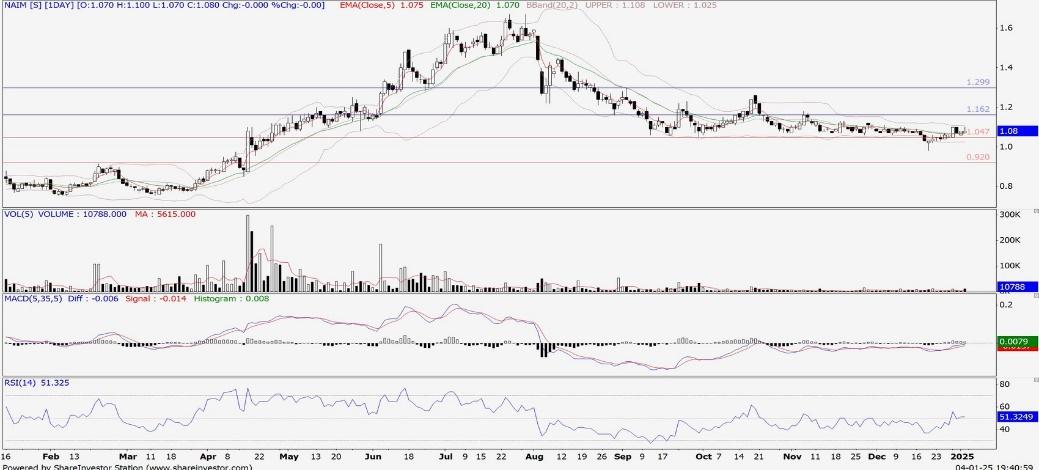
TECHNICAL BUY: NAIM (5073)
PublicInvest
Publish date: Mon, 06 Jan 2025, 09:45 AM

| Key Technical Analysis | |||
| Last closing price: RM1.08 | |||
| Support Level | Share Price | Resistance Level | Share Price |
| 1st Support | 1.05 | 1st Resistance | 1.16 |
| 2nd Support | 0.980 | 2nd Resistance | 1.23 |
| 3rd Support | 0.920 | 3rd Resistance | 1.30 |
Description
The Group is one of Malaysia's leading contractors.
Fundamentals
The Group is closely monitoring current construction projects on hand to ensure timely completion and achieve the expected returns.
| Key Financial Data | |||
| Growth / Ratio | FY21 | FY22 | FY23 |
| Revenue growth (%) | -28.35 | -12.71 | -14.00 |
| Normalised net income growth (%) | - | - | 59.04 |
| Return on equity (%) | -6.10 | 1.99 | 2.72 |
| Return on asset (%) | -4.03 | 1.36 | 1.94 |
| Price earnings ratio (x) | - | 10.61 | 11.64 |
| Price to book ratio (x) | 0.25 | 0.20 | 0.31 |
| Debt to equity ratio (%) | 21.46 | 18.11 | 14.87 |
Source: PublicInvest Research - 6 Jan 2025
Related Stocks
| Chart | Stock Name | Last | Change | Volume |
|---|
More articles on PublicInvest Research
Discussions
Be the first to like this. Showing 0 of 0 comments


