PublicInvest Research
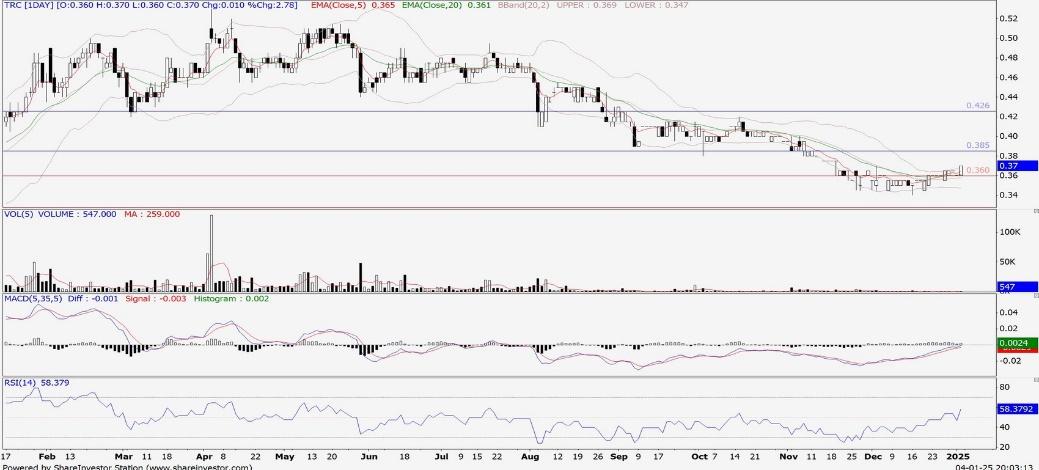
TECHNICAL BUY: TRC (5054)
PublicInvest
Publish date: Mon, 06 Jan 2025, 09:45 AM

| Key Technical Analysis | |||
| Last closing price: RM0.370 | |||
| Support Level | Share Price | Resistance Level | Share Price |
| 1st Support | 0.360 | 1st Resistance | 0.385 |
| 2nd Support | 0.340 | 2nd Resistance | 0.405 |
| 3rd Support | 0.315 | 3rd Resistance | 0.425 |
Description
TRC is involved in engineering and construction, property development and oversea business investments, particularly in Australia.
Fundamentals
The Group remains committed to completing existing projects, securing RM736m in 1H24. It actively seeks new opportunities and participates in government and quasi-government tenders to replenish its RM860m order book.
| Key Financial Data | |||
| Growth / Ratio | FY21 | FY22 | FY23 |
| Revenue growth (%) | 1.10 | -10.99 | 0.16 |
| Normalised net income growth (%) | -24.87 | 149.49 | -48.12 |
| Return on equity (%) | 4.67 | 11.26 | 4.86 |
| Return on asset (%) | 1.77 | 4.66 | 2.39 |
| Price earnings ratio (x) | 7.40 | 2.65 | 6.90 |
| Price to book ratio (x) | 0.35 | 0.29 | 0.33 |
| Debt to equity ratio (%) | 35.83 | 31.62 | 18.46 |
Source: PublicInvest Research - 6 Jan 2025
Related Stocks
| Chart | Stock Name | Last | Change | Volume |
|---|
More articles on PublicInvest Research
Discussions
Be the first to like this. Showing 0 of 0 comments


