Stevent Hee
Method of identify stock market cycle
StallionInvestment
Publish date: Tue, 12 Feb 2019, 12:58 AM
Today i received another question how could we identify each and different stages. It is easy to say base on historical chart. Is there a method for us to identify it. I will explain in more detail in this article so that you able to understand better the stock market cycle.
Phase 1 : Accumulation Phase
Criteria : Very low volume on daily basic and trade within tide range for some time.
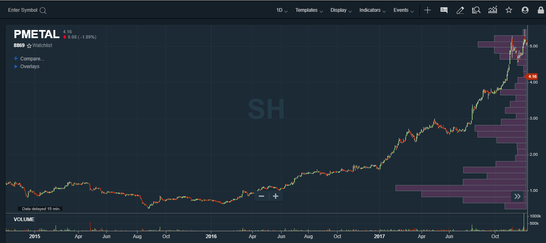
Traditional method of identify accumulation is when the volume is thin and it been trade for may be few months or year then when it start to kick off then enter position. The question is that you don't know how heavy is the accumulation phase till you gather the data and put into excel which is very troublesome. Therefore, you can leverage on software to see a clearer picture.
 XL
XL
What do you see is the Y-axis on the right showing the price transacted volume instead of refer to X-axis which is daily volume. This give us a clearer picture showing how many volume traded at the low price range.
Conclusion: If you having this PRICE VOLUME DISTRIBUTION CHART
then you able to understand the situation where the "MAJOR PLAYER" is holding their position.
Phase 2 : Uptrend/ Mark Up Phase
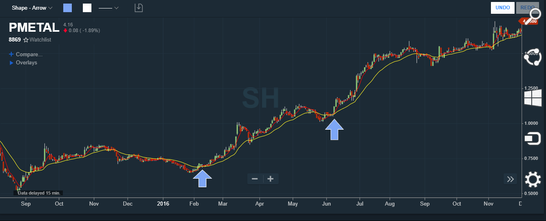
When come to this phase, there is 2 method which people commonly use which is the 5MA CROSS ABOVE 20EMA
 XL
XL
This is for the people who prefer to do swing trading to adopt such strategy.
Some will adopt short term trading during Mark Up Phase which i have develop this method as 1 CROSS 4
Criteria 1 : Today closing Price is higher than past 4 days closing price
Criteria 2 : Today closing volume improve by 40% compare to yesterday
Criteria 3 : Today closing volume higher than past 4 days volume
Criteria 4 : Minimum Today Transaction volume is 500,000 shares.
There is another 4 more criteria to increase the winning probability. Wanna know more then join my upcoming Technical Course.
You can search this potential counter by going through top volume or top gainer which cost you zero cent.
Alternatively, you can purchase my customise screener to find out potential stock.
Attach is the screenshot of the screener.
 XL
XL
Phase 3 : Distribution Stage
 XL
XL
If you notice huge volume traded at high side is the indication this counter is facing distribution stage.
Although this is so call fundamental stock, super bull stock. But when you identify such pattern, what happened later on?
 XL
XL
I guess the chart tell you pretty well where they are heading to right now.
Do subcribe and follow my FB and Telegram link for more update.
Telegram Link : https://t.me/steventhee628
FB Link : https://www.facebook.com/Steventheeinvestment/
More articles on Stevent Hee
Discussions
Be the first to like this. Showing 0 of 0 comments


