TECHNICAL STOCK WATCH - SCICOM - STEVENT HEE
StallionInvestment
Publish date: Fri, 26 Apr 2019, 06:51 PM
What you should know about SCICOM?
EPF actively acquire SCICOM lately. Information shown as below:
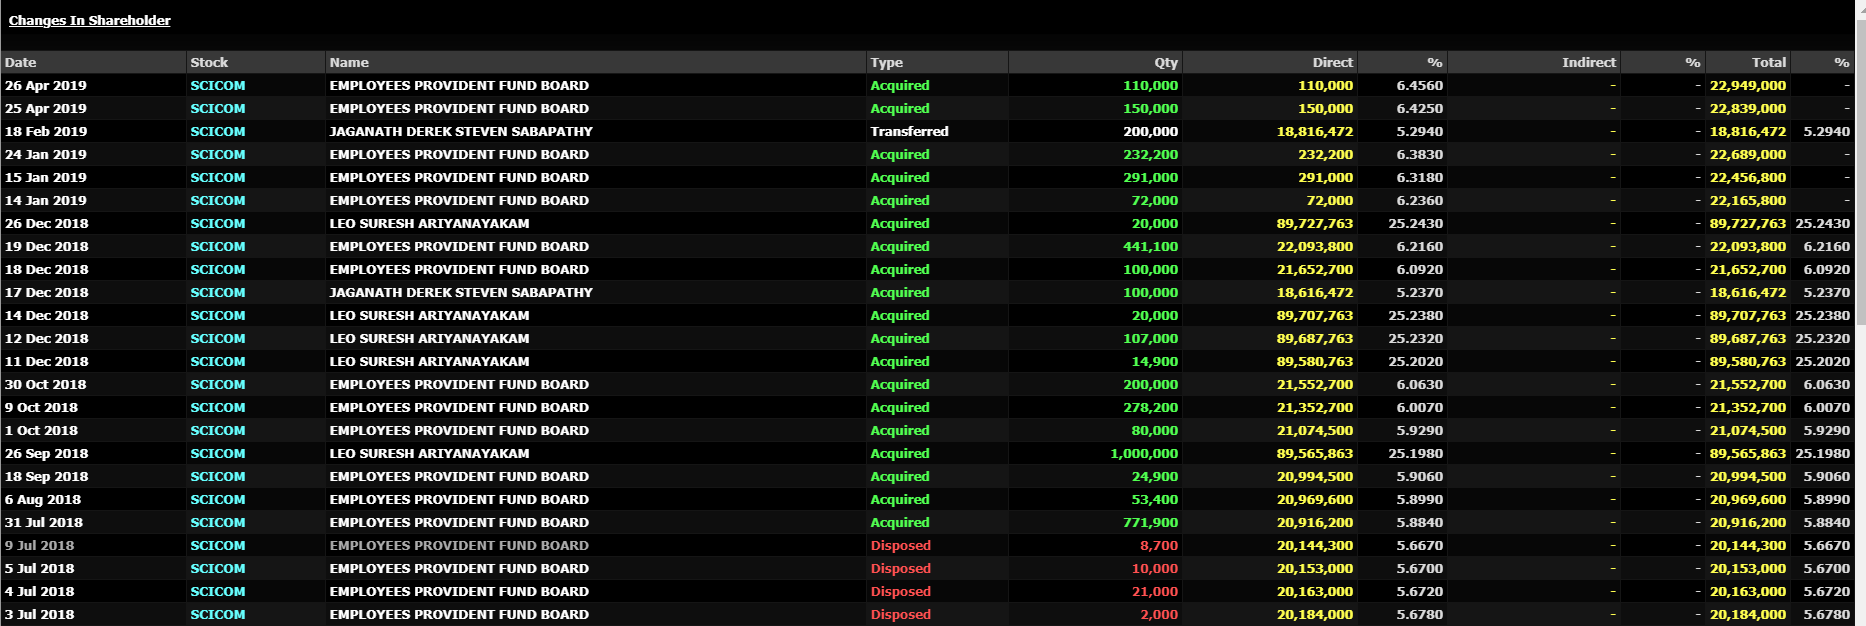
Share holding from the last dispposal was having 5.667% last year increase to 6.456% base on recent announcement.
DIVIDIEND YIELD : 7.8%
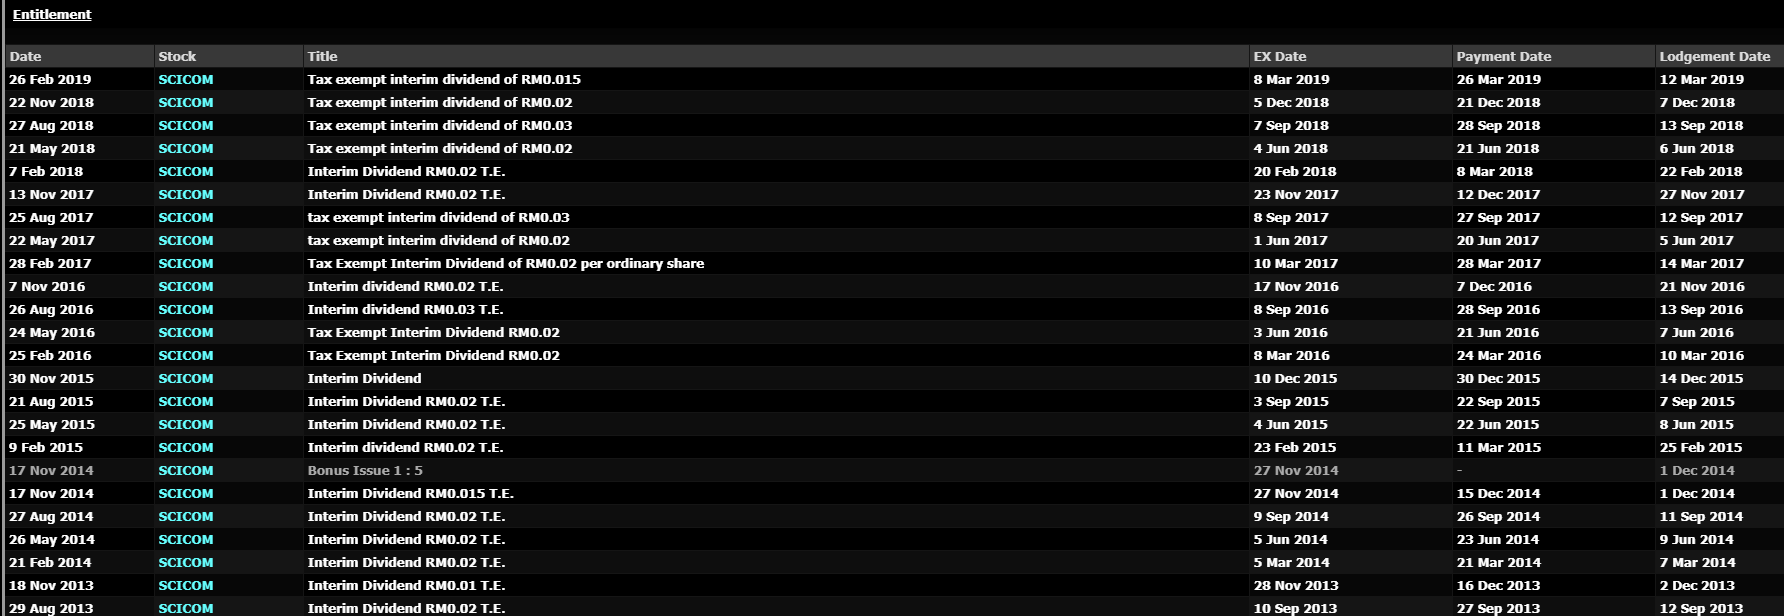
HISTORICAL FINANCIAL SUMMARY SHOWN AS BELOW :
CONSECUTIVE 3 QUARTER INCREASE IN REVENUE AND PROFIT AT MARGINAL LEVEL

NET CASH COMPANY
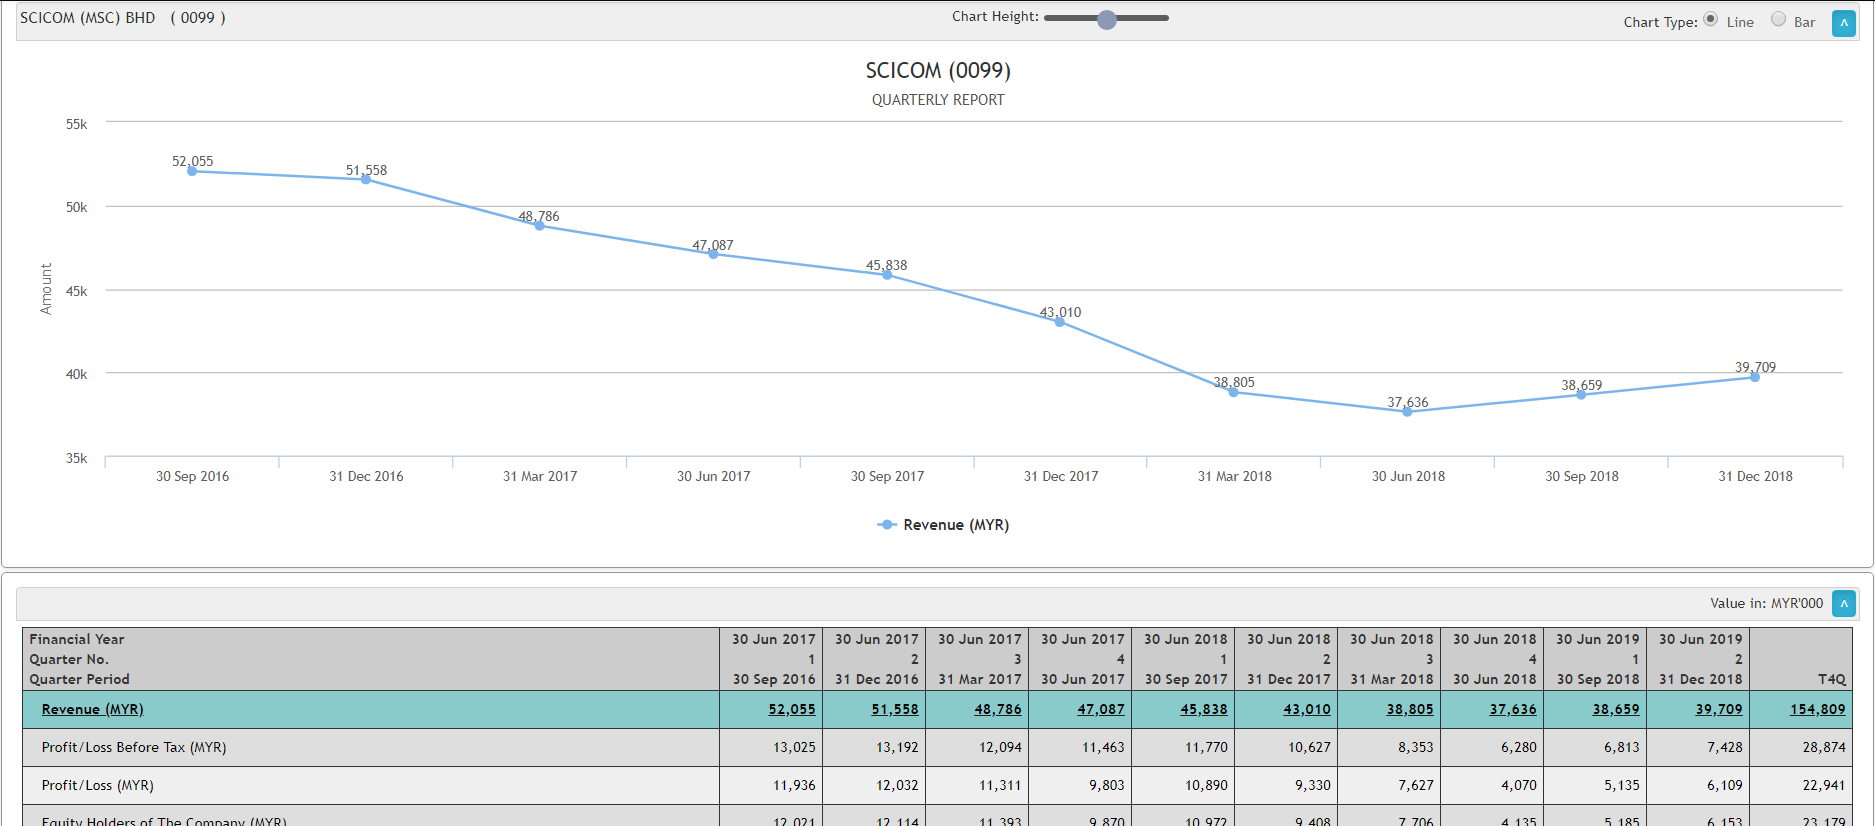
Bottoming up for the quarterly report for SCICOM as you can see from the chart.

TOP 10 shareholder got EPF, LIBRA INVEST and Kumpulan Wang Persaraan. Big name which you can name it and holding on it.
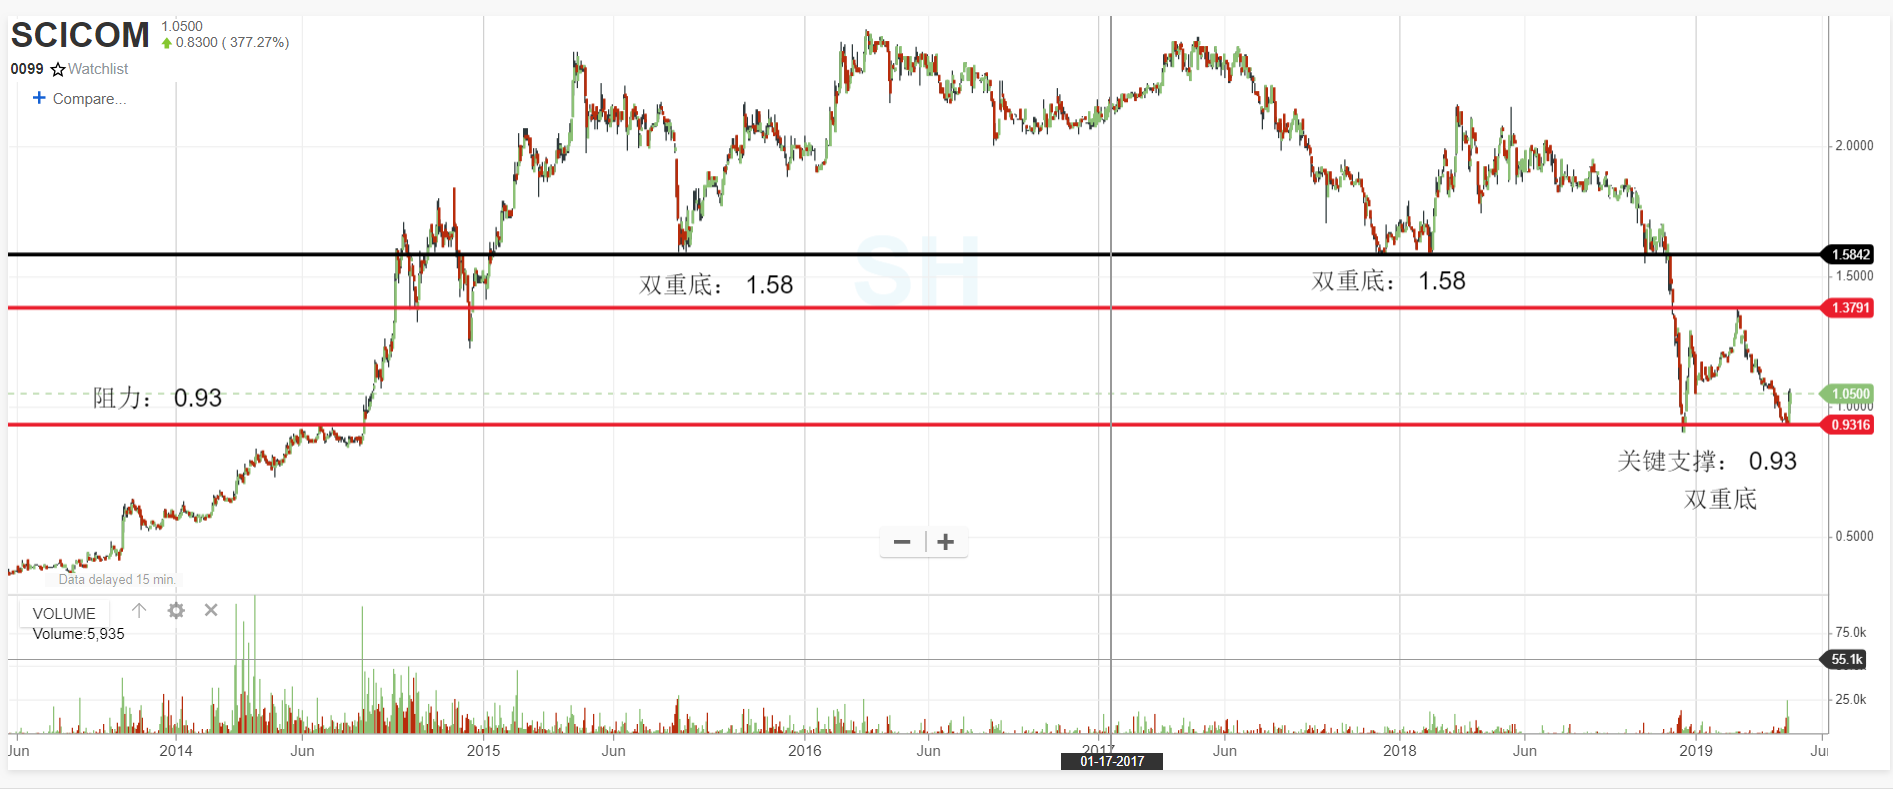
Weekly Chart Outlook :
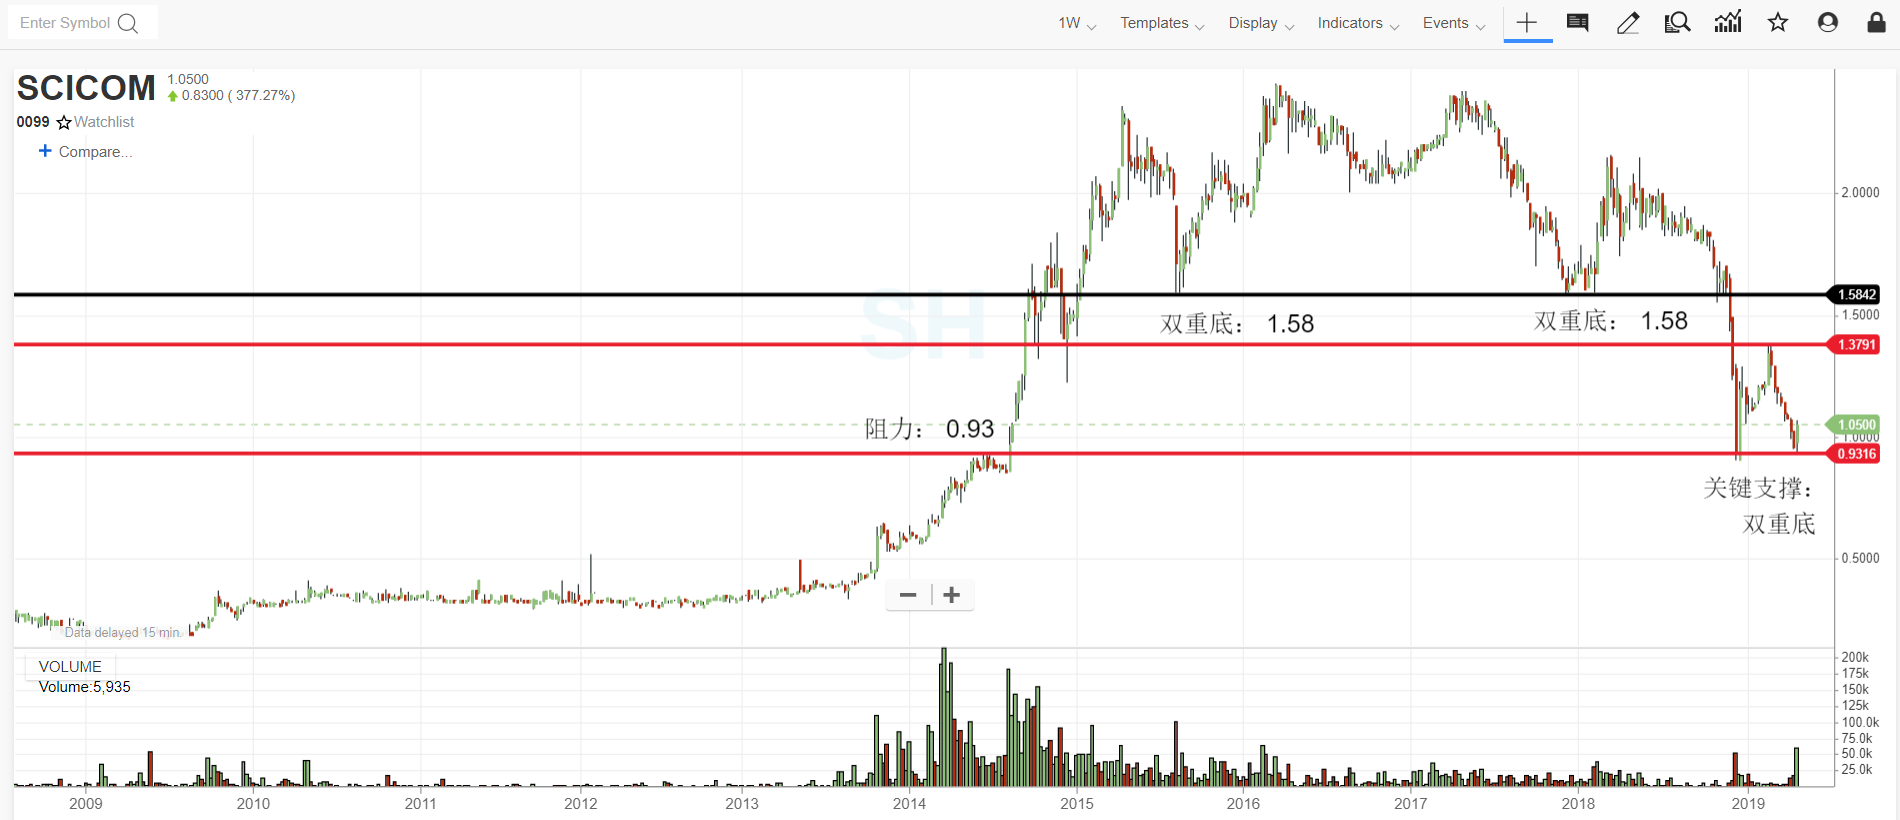
WEEEKLY CHART
SUPPORT : 0.93
RESISTANCE : 1.38 ; 1.58
Daily Chart Outlook :
DAILY CHART
SUPPORT : 0.975 ; 1.02
RESISTANCE : 1.20 ; 1.34
TECHNICAL INDICATOR INTEPRETATION :
DIVERGENCE FORMATION BETWEEN PRICE AND MACD : BULLISH FORMATION
SH TREND : BULLISH
BOLLINGER BAND : POSITIVE TERRITORY
IMPROVING TRADING INTEREST FOR SCICOM INDICATE MORE TRADING ACTIVITY TO BE SEEN FOR THE COMING WEEK.
RECENT NEWS :
DATE : 1 JAN 2019
Scicom (MSC) Bhd founder and CEO Datuk Seri Leo Ariyanayakam is getting excited about the new government’s assurance that concessions will be awarded through an open tender system, he has been caught off guard by the plunge in Scicom’s share price.
In fact, the company has submitted its bid for the selected fuel-subsidy solution before the tender closed on Dec 10.
The Home Ministry’s decision to scrap the RM3.5 billion National Immigration Control System project that was awarded to Prestariang Bhd and replace the existing 20-year-old system with a fully online Integrated Immigration System has created a strong ripple effect on other companies that also have e-government contracts under their belts, including Scicom.
Source obtain from https://www.theedgemarkets.com/article/scicom-sees-level-playing-field-instead-risk
TARGET PRICE GIVEN BY RESEARCH HOUSE : 1.21
SOURCE OBTAIN FROM https://klse.i3investor.com/servlets/ptres/49637.jsp
HOT MONEY ACCUMULATION / DISTRIBUTION LEVEL :
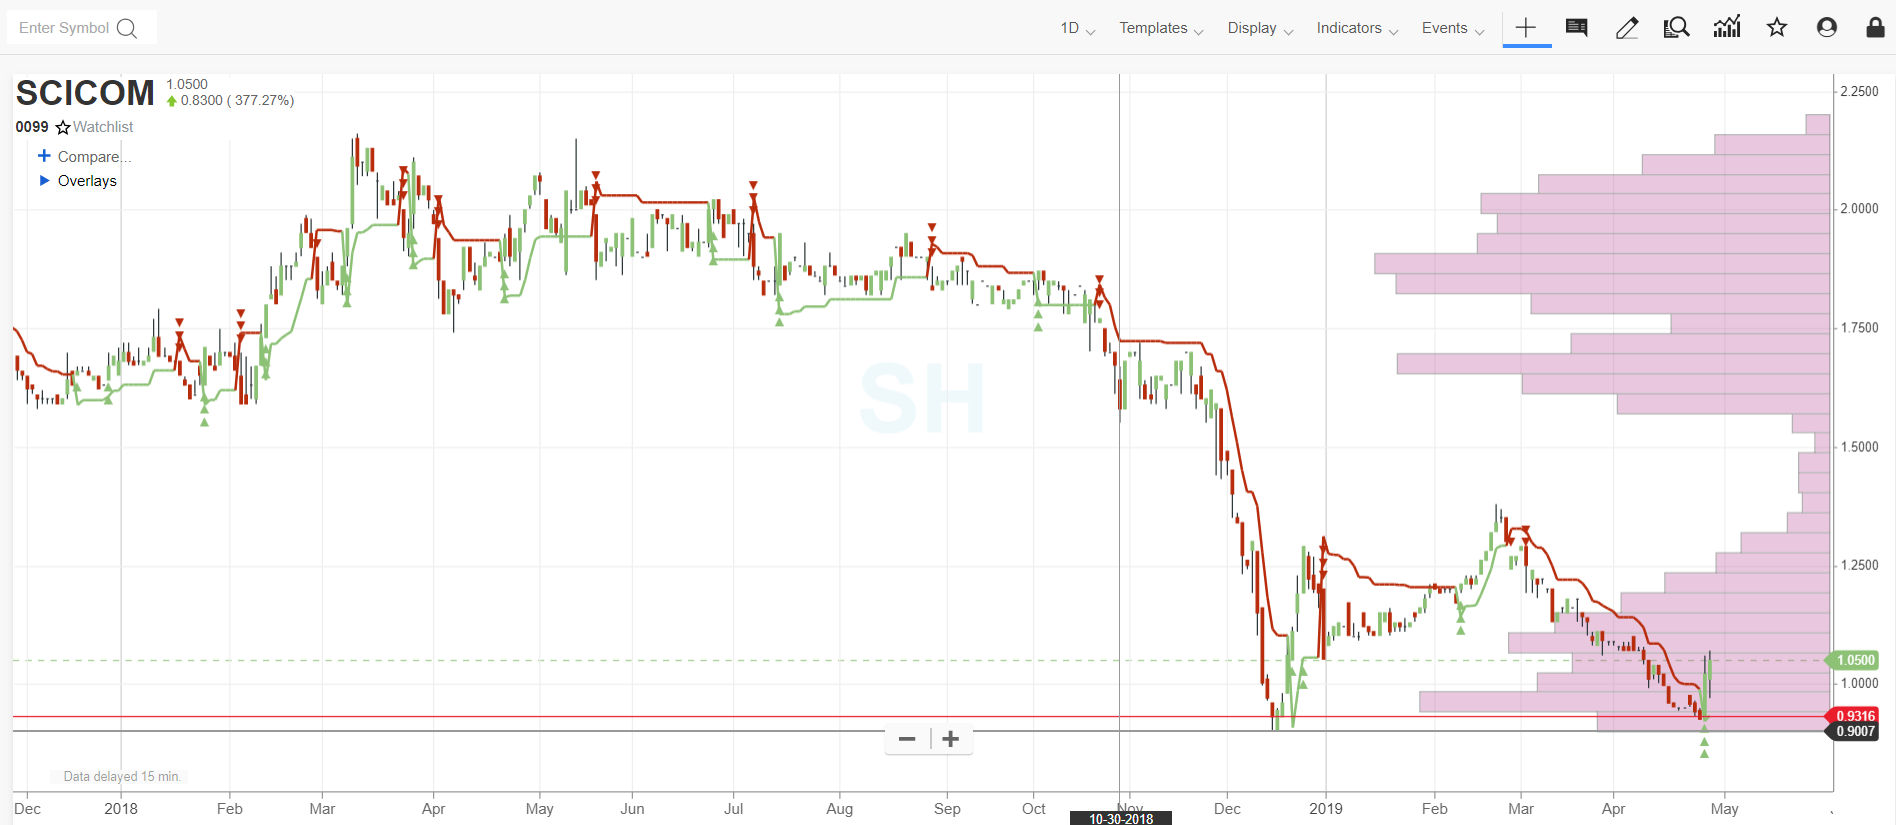
As you can see from above chart, there is accumulation at the bottom range from 0.93 - 1.03
Investor who being trap at the higher price level base on volume interpretation should be range from 1.58 - 1.70. Then next level is within the range from 1.80 - 1.90.
Some of interesting historical aritcle for your personal reading
DATE : 29 AUG 2018
COUNTER : RANHILL
https://klse.i3investor.com/blogs/SICStockPick/171824.jsp
DATE : 21 FEB 2019
COUNTER : KAREX
https://klse.i3investor.com/blogs/SICStockPick/194308.jsp
DATE : 14 APRIL 2019
COUNTER : TDM
https://klse.i3investor.com/blogs/SICStockPick/202241.jsp
DATE : 15 APRIL 2019
COUNTER : DRBHCOM
https://klse.i3investor.com/blogs/SICStockPick/202271.jsp
Hope you like my article and do follow my fb. Happy weekend.
FB : https://www.facebook.com/Steventheeinvestment/
Telegram : https://t.me/steventhee628
免责申明: 以上文章纯属个人意见以及学术性分享,不构成任何买卖建议。在你做出任何买卖之前,建议您和你的股票经纪质询任何投资意见。买卖风险自负
Disclaimer: Above article is for educational sharing purpose. Kindly consult your dealer/remisier for any investment advise before you make any decision. Trade at your own risk.
Related Stocks
| Chart | Stock Name | Last | Change | Volume |
|---|


