


“Free cash flow is what’s left over after the normal capital spending is taken out.” - Peter Lynch

What Is Free Cash Flow And Why Is It Important To Value Investors?
Cash in the bank is what every company, and investor, strives for. Companies with large amounts of cash have options to increase dividends, perform buybacks, or reinvest the capital back into their business. Cash flow is the amount of cash coming in minus the amount of cash going out of the company's bank.
Free cash flow (FCF) is a subset of cash flow and is the amount remaining after business expenses and capital expenditures have been paid, hence the term "free." In other words, this is the cash management can use to really create value for the company as well as shareholders. For simplicity sake let's use Apple as an example. We'll want to use at least a 5yr history for all out calculations to account for business cycles and to smooth out data.
Free Cash Flow (FCF)
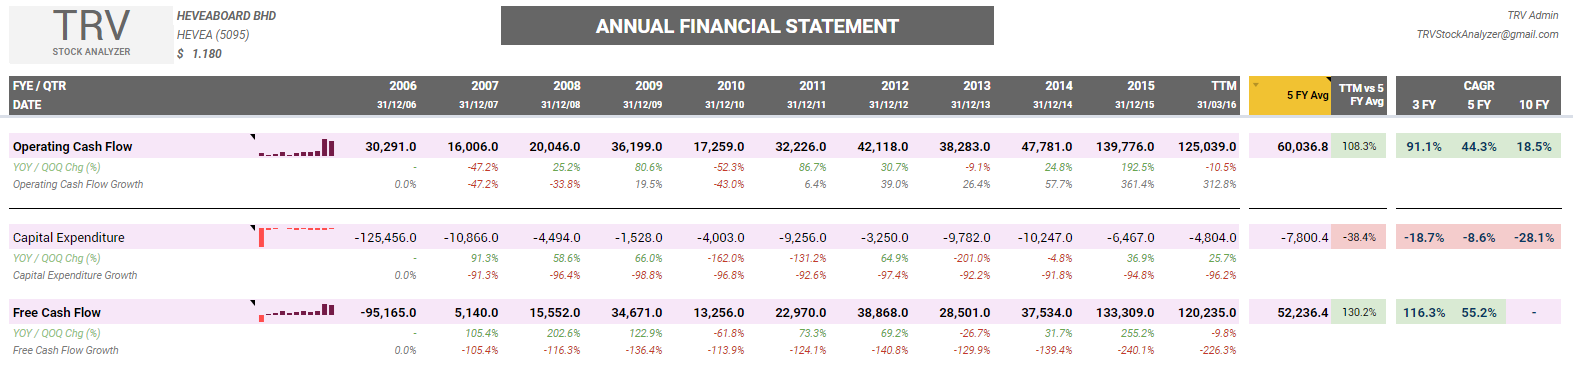
Free Cash Flow (FCF) = Operating Cash Flow - Capital Expenditures (CAPEX).
Some simple calculations:
2015 FCF = 139,776.0 - 6,467.0 = 133,309.0
5yr Average FCF = (22,970.0 + 38,868.0 + 28,501.0 + 37,534.0 + 133,309.0) / 5 = 52,236.4
These numbers are all automatically calculated.
FCF Growth
Not only can we use FCF growth as an indicator of the company's real growth rate over the last 5 years, we can also determine the rate at which the company has grown organically. By analyzing FCF we exclude other factors and focus only on operating cash flow growth. Meaning we're concentrating on the firm's primary business rather than growth from issuing more shares or debt.

A 10 years FCF growth of 8.0% is a good number for a big company like Nestle. However do keep in mind you're looking at the past with this number. It's not a guaranteed future growth rate, but it's still a nice number to start with.
Now that you understand what FCF is and why it's useful, let's look at some ways to integrate this figure by using it in 3 different valuation metrics.
1. FCF Margin (FCF / Sales)
This is a ratio that tells you what percentage of sales is transformed directly to FCF. While we definitely care about growth and yield, the FCF to sales metric shows profitability combined with business operations.
FCF Margin = ( FCF / Revenue ) x 100
Typically any number above 15-20% means the company is a cash-cow that has a significant competitive advantage. However, this number varies across different industry.
2. FCF Yield
First up is FCF yield. This metric allows you to calculate the current valuation of a stock and compare it with other investments. In other words, it tells if a company is trading at a discount and how steep that discount is compared to other companies AND investments, such as bonds.
FCF Yield = ( FCF / Market Capitalization ) x 100
Usually anything above 10% is something to look into, especially when bank fixed deposits and other investments such as funds / bonds are earning around 3% - 5% right now.
3. EV / FCF
Simply the better version of inverse of FCF yield. You can use this metric in place of P/E or EV/EBIT and I wouldn't blame you since using FCF is always preferable, in my opinion, to earnings.
EV / FCF = Enterprise Value / FCF
An EV/FCF below 10 could be a bargain. Historically, the great Warren Buffett has invested in companies trading at these levels.


Click to enlarge. Diagram showing 10 years FCF Margin, Yield and EV/FCF for Hevea highlighting its 5 latest years average).
Summary
In the end, FCF metrics are very beneficial. You can use them to verify earnings, determine a realistic growth rate, and even as valuation techniques. As we continue this series we'll dive deeper into all the different ways you can use cash flow numbers. Stay tuned for part two where we'll discuss cash generating power (excitingly named) as well as several others.
------------
Get 10 Years and 10 Quarters company financial data loaded and calculated automatically with TRV Stock Analyzer.
Facebook Page : www.facebook.com/TRVStockAnalyzer
View samples of TRV Stock analyzer for Nestle & Hevea at link below:
NESTLE Sample: https://goo.gl/mLRWKn
HEVEA Sample: https://goo.gl/W697vf


ACELEE
Appreciate your sharing bro.but But I do also noticed QL is a at negative Fcf during 2001-2010 for most of the years but share price gains by multiple though!!!
2016-08-05 17:37