


The Stock Library
KLSE CHART ANALYSIS FBMKLCI 17 December 2012

Edwin Toh
Publish date: Mon, 17 Dec 2012, 08:38 PM
Edwin Toh
0 184
Talk about everything all under one roof which help us profit big money!! This blog have Technical Analyze Chart on Selected Stock and Forum for Daily Buy and Sell Call.
Disclaimer
All observation, buy call and sell call based on my own personal view are just for informational purpose and for my personal references to remind my self what i have analyze before and now for self improvement. Buy at your own risk and do not follow my view as i am only a novice analyzer with 60% success only..
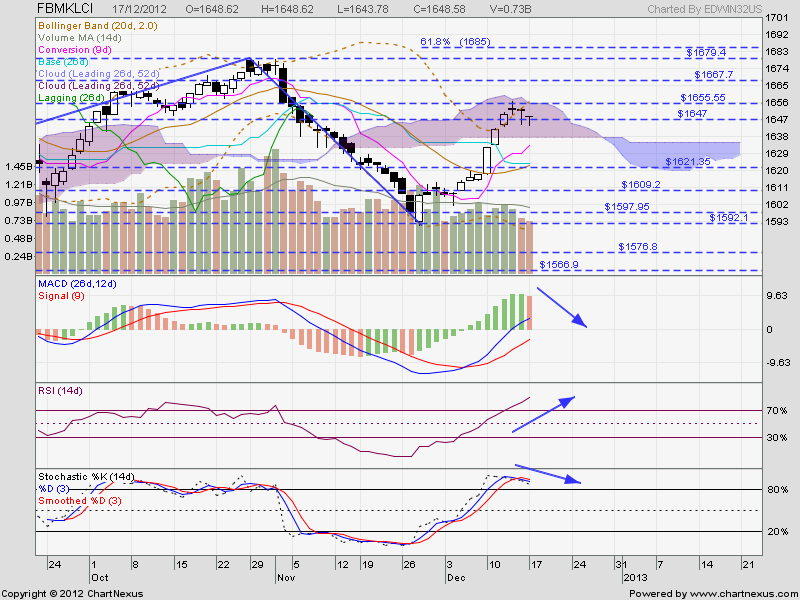
Formed 2 hanging man on the 1647 support line. It is a crucial whether if it hook up it will be another round of bull but if break below it will confirm in bearish mode because it will closed as lower high.

Indicators
Indicators
1 ) Trendline - Uptrend
2) Support/Resistance - Formed lower low ( Bearish )
2) Support/Resistance - Formed lower low ( Bearish )
3) MACD -Formed 5G1R ( Bearish )
4) RSI - Broke above 70% (Bullish) ,
4) RSI - Broke above 70% (Bullish) ,
5) STO - Bearish crossover ( Bearish )
6) Ichimoku - a) Price coming entering from the resistance cloud and testing the upper resistance( Bullish ).
6) Ichimoku - a) Price coming entering from the resistance cloud and testing the upper resistance( Bullish ).
b) Conversion line above the base line ( Bullish ).
c) Price close above the baseline ( Bullish ) .
c) Price close above the baseline ( Bullish ) .
7) Candlestick - Hanging man ( Bearish ) Please refer here for more information
Conclusion:
Bullish
Need to maintain above 1647 to remain bullish
Resistance- 1655/ 1668 /1681 /1725
Support - 1649 / 1621 /1600 / 1594 / 1581
More articles on The Stock Library
Discussions
Be the first to like this. Showing 0 of 0 comments
Post a Comment
Featured Posts


Latest Videos


Apps


Top Articles
1
2
Koon Yew Yin's Blog
3
Good Articles to Share
5
BFM Podcast
6
Koon Yew Yin's Blog
Why all plantation companies will continue to report more profit - Koon Yew Yin
7
8
#
Stock
Score
Daily Stocks
Stock Name
Last
Change
Volume
Stock Name
Last
Change
Volume
Stock Name
Last
Change
Volume
MQ Trading Signals
Stock
Time
Signal
Duration
Stock
Time
Signal
Duration
Featured Advertisers / Partners


Ride The Bull Short The Bear
CS Tan
4.9 / 5.0
This book is the result of the author's many years of experience and observation throughout his 26 years in the stockbroking industry. It was written for general public to learn to invest based on facts and not on fantasies or hearsay....