


Valunomics
Valunomics: Apex Healthcare Berhad

klse: ahealth
Investment valuation
April 27, 2017
Overview
1. Company Background and Description
Taken from Apex Healthcare Berhad (from here on “Ahealth”) annual report:
“Since our establishment in 1962, our business has been focused on making pharmaceutical and healthcare products available to customers in the markets in which we operate, through manufacturing and distribution, and in a manner which fairly rewards all stakeholders. We know our business intimately and have a growing network of loyal customers; this will remain our business for the future. Our confidence in our business stems from a conscious decision to focus resources on our area of expertise, which enables us to increase our capabilities, efficiencies and understanding of underlying trends in the industry.”
2. Company Operating Segments
Ahealth current reports that the group is organized into three main business units based on their products, and has three reportable operating segments as follows:
(i) Manufacturing and marketing of pharmaceutical products;
(ii) Wholesale and distribution of pharmaceutical and healthcare products; and
(iii) Corporate comprising investments in retail pharmacy business and properties and the provision of
management services.
The current revenue contributions for the operating segment are 17% from manufacturing and marketing of pharmaceutical products and remaining 83% from wholesale and distribution of pharmaceutical and healthcare products. Corporate operating segment will not be part of the valuation as it will be assume to not to contribute significantly to core operating business.
3. Operating Segment Sector Analysis
3.1. Pharmaceutical segment
For the Pharmaceutical segmentsector the following are the attributes of companies considered:
Geographic Locations: Far East and South-East Asia;
Industry Classifications: Pharmaceutical Product Distribution;
Following are the results Pharmaceutical segmentof sectors:
No of Companies = 258;
EBIT Margin, (%) = 13.56%;
Effective Tax, (%) = 17%;
Return on Invested Capital (%) = 15.08%;
3.2. Pharmaceutical product distribution segment
For the Pharmaceutical product distribution segmentsector the following are the attributes of companies considered:
Geographic Locations: Far East and South-East Asia;
Industry Classifications: Pharmaceutical Product Distribution;
Following are the results of Pharmaceutical product distribution segmentsectors:
No of Companies = 31;
EBIT Margin, (%) = 3.88%;
Effective Tax, (%) = 23%;
Return on Invested Capital (%) = 14.81%;
3.3. Operating segment analysis
The implied operating margin for Ahealth is 5.55% with the following assumptions:
1. Revenue contribution weightage for both manufacturing and distribution segments of 17% and 83% respectively to continue into the future;
2. EBIT Margin contribution of each segment per section 3.1 and 3.2 above;
The current operating margin for Ahealth is 6.93% which is 1.38% higher than the implied operating margin above.
The 3 years average operating margin for Ahealth is 7.76% which is 2.21% higher than the implied operating margin above.
4. Growth Rate Analysis
Operating margin growth rate projection may be derived as the return on capital multiplied by the reinvestment rate of Ahealth’s business. Considering the last 3 years average results the return on capital of Ahealth is 15.3% and the reinvestment rate is 28.7% this implies a growth rate of 4.4% CAGR. This is taking 7.76% operating margin and 25.1% effective tax rate.
Considering the last 5 years average results the return on capital of Ahealth is 15.6%, reinvestment rate is 49.7%, operating margin 8.5% and effective tax rate of 26.4% will imply a growth rate of 7.8% CAGR.
Considering the last 10 years average results the return on capital of Ahealth is 15.9%, reinvestment rate is 47.5%, operating margin 8.3% and effective tax rate of 22.4% will imply a growth rate of 7.6% CAGR.
Historically this is consistent with the 5 years average historical Downside Risk Adjusted CAGR (DRACAGR) for Revenue of 7.90% with a 0.31% downside standard deviation and a 25.72 Sortino Ratio.
For recordkeeping sake, the 5 years average historical DRACAGR for EBT is 2.34% with a 7.78% downside standard deviation and a 0.33 Sortino Ratio. In addition to that 5 year average historical DRACAGR for Operating Margin is -4.33% with a 11.00% downside standard deviation and a -0.44 Sortino Ratio.
5. Discounted Cash Flow Valuation
5.1. Implied Growth Baseline
For the implied growth baseline going-concern DCF valuation the following assumptions were considered:
1. Revenue CAGR at 4.4% to grow from current revenue level for a period of 5 years and then from year 6 to 10 the growth rate will level off to half of Year 1 to 5 CAGR assuming that the company matures.
2. Operating margin considered is at a constant 7.8% for year 1 to 10.
3. Effective Tax Rate to increase from the current existing effective tax rate which to grow on a consistent CAGR basis to the marginal tax rate of the country from year 6 to 10.
4. Weighted average cost of capital to assume at 6.25% at risk free rate of 4.11%, beta of 0.31, an equity risk premium of 7.03% and the cost of debt is minute and will not be mentioned here.
5. Terminal growth rate after year 10 to be considered is 2.20%.
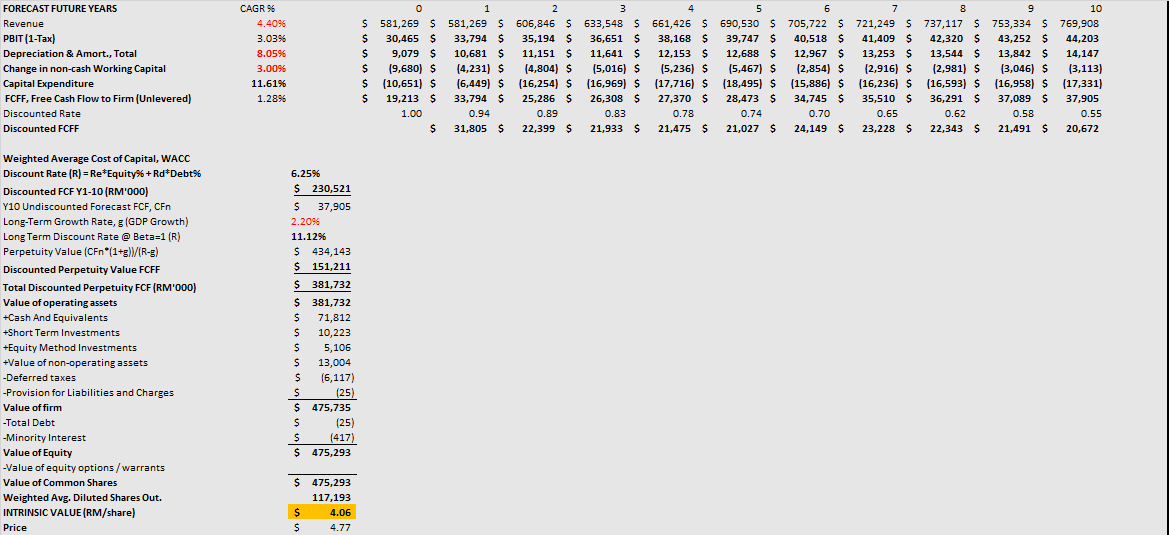
The total firm value is MYR 475 mil and the total equity value is MYR 474 mil which translates to RM 4.06 per share.
5.2. Sector Average Baseline
For the sector average baseline going-concern DCF valuation the following assumptions were considered:
1. Revenue CAGR same as implied growth baseline.
2. Operating margin considered is at a constant 5.55% for year 1 to 10.
3. Effective Tax Rate same as implied growth baseline.
4. Weighted average cost of capital same as implied growth baseline.
5. Terminal growth rate same as implied growth baseline.
The total firm value is MYR 345 mil and the total equity value is MYR 344 mil which translates to RM 2.94 per share.
5.3. Historical Baseline
For the sector average baseline going-concern DCF valuation the following assumptions were considered:
1. Revenue CAGR at 7.90% to grow from current revenue level for a period of 5 years and then from year 6 to 10 the growth rate will level off to half of Year 1 to 5 CAGR assuming that the company matures.
2. Operating margin same as implied growth baseline.
3. Operating margin same as implied growth baseline.
4. Effective Tax Rate same as implied growth baseline.
5. Weighted average cost of capital same as implied growth baseline.
6. Terminal growth rate same as implied growth baseline.
The total firm value is MYR 517 mil and the total equity value is MYR 516 mil which translates to RM 4.41 per share.
6. Recommendation
As of 26 April 2017, Ahealth closed at MYR 4.77 this translates to about a baseline overprice of MYR 0.36 – MYR 1.83 range. Therefore I cannot recommend a buy at the current going concern.
Related Stocks
| Chart | Stock Name | Last | Change | Volume |
|---|
Market Buzz
More articles on Valunomics
Featured Posts
Introducing MY's First IPO Fund for Sophisticated Investors!
New Update. Discover investment communities that resonate with your ideas
M & A Value Partners IPO Equity Fund has been launched - Targeted 13% Return p.a
Latest Videos


MQ Trading Signals
Time
Signal
Duration
Type
2024-12-23 16:50:00
EMA 5
5 Mins
SELL
2024-12-23 16:40:00
ADX
10 Mins
SELL
2024-12-23 16:40:00
TURTLE SYSTEM 20
10 Mins
SELL
2024-12-23 16:40:00
ADX
5 Mins
SELL
2024-12-23 16:40:00
TURTLE SYSTEM 20
5 Mins
SELL
Apps


Top Articles
1
save malaysia!
2
4
Stock Market Enthusiast
5
6
save malaysia!
7
Good Articles to Share
Taiwan warns law changes may have ‘serious impacts’ on budget
8
Good Articles to Share
Gold extends gains as US inflation data ease rate cut worries
#
Stock
Score
Daily Stocks
Stock Name
Last
Change
Volume
Stock Name
Last
Change
Volume
Stock Name
Last
Change
Volume
Featured Advertisers / Partners


Ride The Bull Short The Bear
CS Tan
4.9 / 5.0
This book is the result of the author's many years of experience and observation throughout his 26 years in the stockbroking industry. It was written for general public to learn to invest based on facts and not on fantasies or hearsay....