


Valunomics
Valunomics: Top Glove Sdn Bhd (RM2.33)

Updated 12May2017: Corrected error in tax rate and updated the Sensitivity Analysis for the CAGR Growth Range.
1 Overview
The intent this analysis of Top Glove Sdn Bhd (Topglove) to provide the retail investors in Malaysia to properly value the company basis of fundamentals. We shall employ discounted cash flow analysis and this content might be a heavy read for some but this is our third writing for Valunomics now and we are trying to find the reading ‘sweet spot’ so to speak for our audiences. Kindly read, comment and provide your views if any. I am eager to know if there are any mistakes in my valuation.
We believe the market of Topglove is incredibly frothy (i.e. more than 50% froth and only RM2.33 of value). Take this information and evaluate by yourself but we are not touching this stock with a 50 feet pole. We believe the market in pricing in a lot of speculative growth in the company than it has shown in the past and is unlikely to show in the future.
For the current price to be justified we need to PRAY at the margin is close to above +2 standard deviation and the growth sustained must be 12% or higher for the next 5 years consistently. We believe it is very unlikely to happen despite the resilience in the overall business.
If in the event of any Topglove employee or management who reads this. I hope your Employee Stock Options do not have a strike price that is above Rm2.33. Outside of discounted cash flow below, the free cash flow of the company in the last 12 months is not looking rosy as it is generating negative RM156mil in free cash flow which is lowest in its ten year historical due to phenomenal working capital and capex investment. We will see if the company can generate more shareholder value than RM2.33 or worst. I wonder if dividends can be sustained other than using more debts of course.
2 Operating Margins
It is very important that we track the core operations of the business. This over time will determine the overall value of the business. Operating profit in the business are revenue minus cost of goods sold and minus all selling, general and administration expenses plus depreciation and amortization and also all other operating expense. Operating profit used here shall exclude all finance cost and income, other operating profit, non-operating profit and all tax expense (tax expense we will address separately). We notice that Topglove have achieved 13.3% and 13.4% operating margins in 2016 and 2015 FY and many extrapolate this to mean that similar is to be expected in the coming years. We think this is a dangerous assumption as we observed that in years 2011 to 2014 the operating margin has fluctuated from 5.2%, 9.2%, 8.5% and 7.7%. We shall observe the long term normalized trend and make a projection basis of that rather. The 3 year average, 5 year average and 10 year average are respectively 11.1%, 10.4% and 10.5%. Manufacturing businesses are heavily capital intensive businesses and are in need of asset investments for the business to grow in capacity. I would caution the ordinary investor to assume much margin expansion to equate to the outcome of the capital expansion that the glove industry had ventured in the last 3-5 years.
We shall take the operating margin to be 10.4% as the likely margin observed in the long run for the discounted cash flow analysis. This is the 5 year average records and would extrapolate to about 14.7% to 14.2% of return on capital which is already very favorable.
Note that in the last four quarters report with the latest being 28 Feb 2017 report, the operating margins are at 9.7%. Hence we believe 10.4% above should be in the ballpark. We observe this as the trend downwards as a result of mean reversion is happening in the industry.
We would also add that we observe that the 5 years standard deviation of the profit margins are about 2.1% range hence the +1 standard deviation of the operating margin is 12.5% and -1 standard deviation is at 8.3%. Assuming that it is normal distribution the probability of likely for it to fall in this range is 68%. If we continue this to the +2 standard deviation and -2 standard deviation the operating margin are respectively at 14.7% and 6.2% (+2 standard deviation in a normal distribution has a probability of 95%). We shall use this in our DCF sensitivity analysis.
As for taxes, our methodology of arriving to the intrinsic value is to project the likely (and make conservative assumptions where it is necessary) free cash flow in the future by deducting the (1-effective tax rate) of the business observes in the last 10 years and assume that it carry forwards into the future. The average 3 years, 5 years and 10 years effective tax rate observed by Topglove was 18.6%, 17.7% and 18.2% respectively.
3 Core Growth
One way to understand growth is to understand how much the reinvestment of the business into its assets via capex and change in working capital. The rate of the reinvestment into the business in this area will inherently produce operating profit growth. All businesses know that to grow it must reinvest. With the historical figures we can observe that Topglove have on average reinvested at a reinvestment rate of 81%, 84% and 76% for 3 year, 5 year and 10 year averages. To arrive to growth rate we may multiply this by the rate of the business returns on top of the invested capital which is 17.1%, 17.0% and 17.8% respectively. Thus we arrive to core growth of 13.9%, 14.2% and 13.59%. This is phenomenal to the reader might say but hold your horses right there. These are theoretical growth rate; alternatively you may think of it as the maximum growth rate. So what’s the historical growth rate you might add? We have numbers for that: 15.2% CAGR. Very close we might say to our theoretical maximum.
A 14%-15% cagr in core growth found before are historical numbers and we need to make a forward projected growth - a number that we shall use for the next 5 years projections. Considering the last new factory will be completed this year - we presume that the current available capacity will suffice for the business moving forward. Therefore we shall take 7.1% or half of CAGR as our baseline growth for 5 years and on the 6th year to 10th year we shall assume that the growth tapers to the growth rate of the economy of 3.5-4.0% because logically we cannot have Topglove growing at the GDP rate forever in the terminal growth rate. If this happens Topglove economic value will be larger than our country’s economic value.
I can hear the criticism that comes now - 7% growth is too conservative. To suffice this criticism we will provide the core growth rate range in the sensitivity analysis for the viewer's viewing pleasure.
4 Weighted Average Cost of Capital
A 10 year Malaysian bond is at a 3.98% yield to maturity. We shall assume that the Malaysian bond has no default rate (which if true our risk free rate will be lower) and that the risk free rate to be used is hence the same.
As for the risk premium we observed that Topglove receives revenue contribution from Malaysia, Thailand, China and Others with weights of 76%, 16%, 3% and 5% respectively. Assuming that the collective meaningful risk premium for Topglove comes from the weighted average of the premium observed in this country we arrive at a weighted ERP of 7.44%.
We also need a beta to arrive to a cost of capital, we use the weighted sector averages of each rubber business in Malaysia and the subsequent beta observed from Morningstar. Beta is a risk factor measuring the operating risk of the business relative to the average of all equity markets sector averages. We use the bottom up beta method to arrive to a levered beta of 1.0772. Reader would say that this is high and to suffice the reader’s criticism we will also provide a valuation at half of the beta above which is at 0.5 and the difference observed in the valuation is only an increase of RM 0.23 or only 10% increase in value.
Considering the cost of debt and cost of equity and taking the weighted average of the two we arrive to a cost of capital of 11.51%. This is good because it is lower than the return on capital for the company computed above. A company that continuously generate above its cost of capital is a healthy company.
5 DCF Valuation
The valuation for Topglove we arrive to is RM2.33 per share with the following assumptions:
· Revenue CAGR of 7.1%
· Operating margin of 10.4%
· Effective tax rate of 17.7% and grows to 18.6%
· Return on capital of 14.7% to 14.2%
· Terminal growth rate of 3.55%
· Cost of capital of 11.51%
· Addition of all cash, marketable securities, holdings in associates, and other non-operating assets
· Minus all deferred taxes, liability provisions, debts, and non-controlling interest
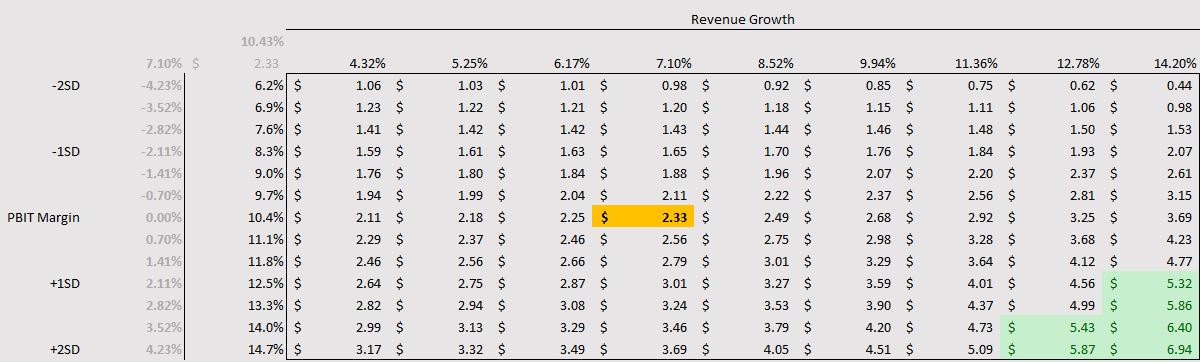
6 Sensitivity Analysis
For sensitivity analysis we have Operating margin on the y axis with range from -2 standard deviations to +2 standard deviations. And we have on the x axis the revenue growth from 4.32% to 14.20% which should cover most growth ranges mentioned in core growth rate section above.
Highlighted in Green are the value that are above the current trading price of RM5.11.
Related Stocks
| Chart | Stock Name | Last | Change | Volume |
|---|
Market Buzz
2024-12-23
TOPGLOV2024-12-23
TOPGLOV2024-12-23
TOPGLOV2024-12-23
TOPGLOV2024-12-23
TOPGLOV2024-12-23
TOPGLOV2024-12-23
TOPGLOV2024-12-23
TOPGLOV2024-12-23
TOPGLOV2024-12-23
TOPGLOV2024-12-23
TOPGLOV2024-12-20
TOPGLOV2024-12-20
TOPGLOV2024-12-19
TOPGLOV2024-12-16
TOPGLOV2024-12-13
TOPGLOV2024-12-13
TOPGLOV2024-12-12
TOPGLOV2024-12-12
TOPGLOVMore articles on Valunomics
Discussions
1 person likes this. Showing 10 of 10 comments
True but the reality is the market is pricing above 14% cagr growth and that's an example of irrational exuberance!
2017-05-11 12:46
trying to impress using magic formulas?
I wonder if you understand the following...
the company is still adding capacity.
it is no where near terminal yet.
and with positive CAGR and positive margins....there is no way this share will drop by half unless there is a World war 3.
That is also the reason I hate number crunchers unless they have business sense to go with it.
2017-05-11 13:01
Capacity needs sales to translate it into revenue. I believe I was being generous to provide the range of cagr in the analysis.
2017-05-11 13:05
DCF can be used to justify Gdex at PE 100 and Top Glove down to $ 2.50........you go figure.
goh....
its called the tail wagging the dog.
2017-05-11 17:55
Well lets wait for your business sense to write a sensible analysis. I haven't seen one yet.
2017-05-11 18:21
yeoh
you haven't seen because you got no sense.
very simple explanation.
one more thing...If Harta can produce good results, so can top glove.
2017-05-11 21:02
wait, you saying 'sense' as in me reading your mind? Oh for sure I don't have that sense. Congrats if you have that sense
2017-05-12 12:10
Stockmanmy,
Yes capacity is not reached, but you think whole world only got top glove? Supermax, Kossan, Hartalega all expanding, and they are expanding very aggressively.
Margins for all of them are being compressed year on year.
Rubber stocks are definitely overpriced, Hartalega is at best a 20PE stock and Top glove a 15 PE. Not their current price.
2017-08-14 19:58
Post a Comment
Featured Posts


Latest Videos


MQ Trading Signals
Time
Signal
Duration
Type
2024-12-23 16:50:00
EMA 5
5 Mins
BUY
2024-12-23 16:40:00
EMA 5
5 Mins
SELL
2024-12-23 16:40:00
ADX
5 Mins
BUY
2024-12-23 16:35:00
EMA 5
5 Mins
BUY
2024-12-23 15:40:00
ADX
5 Mins
SELL
Apps


Top Articles
1
save malaysia!
2
3
Stock Market Enthusiast
Top 3 AI/Data Center Newsflow for the 3rd Week of December - #TENAGA, #YTL, #YTLPOWER
5
6
save malaysia!
7
Stock Market Enthusiast
8
save malaysia!
#
Stock
Score
Daily Stocks
Stock Name
Last
Change
Volume
Stock Name
Last
Change
Volume
Stock Name
Last
Change
Volume
Featured Advertisers / Partners


Ride The Bull Short The Bear
CS Tan
4.9 / 5.0
This book is the result of the author's many years of experience and observation throughout his 26 years in the stockbroking industry. It was written for general public to learn to invest based on facts and not on fantasies or hearsay....
pussycats
Wow, very good analysis. Market will price in future growth in current price. That's why Topglov price is beyond realistic price.
2017-05-11 12:42