


WTI Crude Oil Updates
Daily Futures Commentaries: [WTI Crude Oil] 7/6/2018 - EIA against API's data and drag down oil price to below 65!

InvestorsDoctor
Publish date: Thu, 07 Jun 2018, 10:40 AM
InvestorsDoctor
0 1,969
To get more information on local and foreign futures markets, join us on telegram & Facebook.
Join link: https://t.me/investorsdoctoracademy
Facebook: https://m.facebook.com/investorsdoctoracademy/
Join link: https://t.me/investorsdoctoracademy
Facebook: https://m.facebook.com/investorsdoctoracademy/
7/6/2018
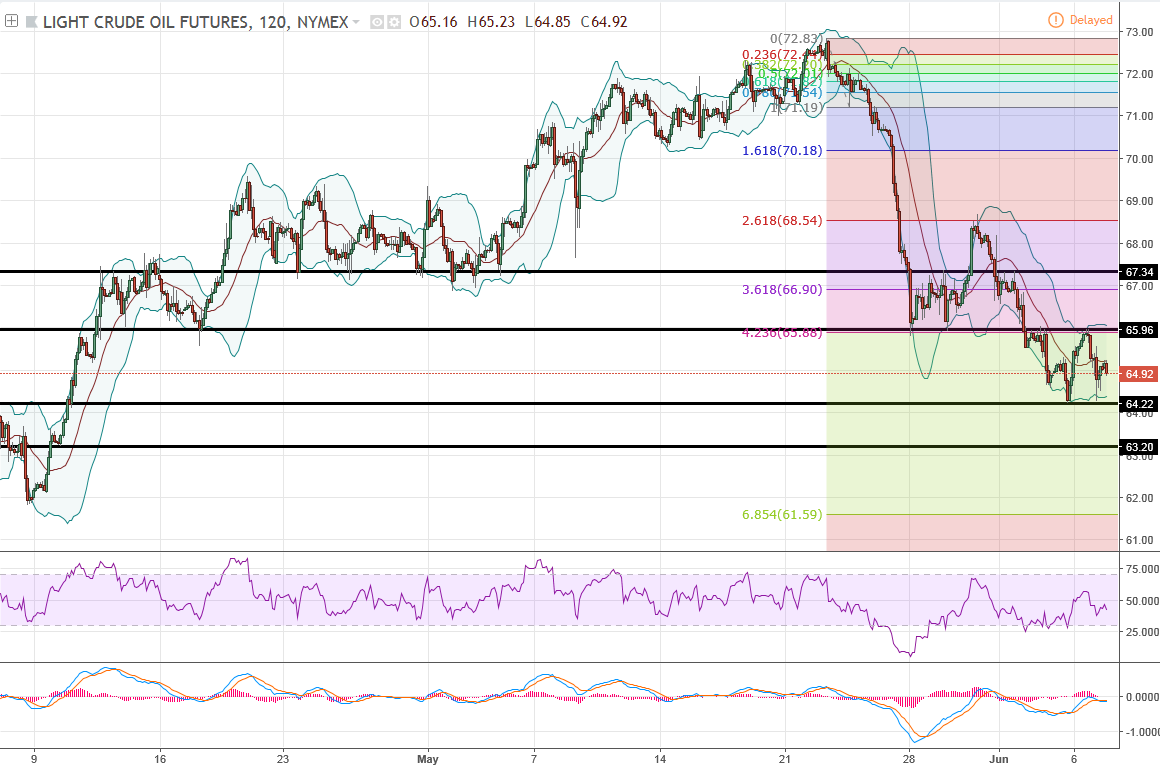
WTI Crude Oil Jul 18
Previous Close: 64.73 -0.73
Crude oil declined on yesterday after EIA stated a surprise build in crude inventories, against data from API.
Daily chart show crude oil may head for more correction as BB expanding downside while RSI & MACD trending downside. Hourly chart also show lower lows & highs, but be cautious as there is a bullish divergence with RSI, may trigger a technical rebound in short term.
Classic Support & Resistance
Resistance: 65.96 67.34
Support: 64.22 63.20
Recommend Trading Plan for the day:
1. Buy 65.01, stop 64.91, profit 65.11/65.21.
2. Look for sell signal if break below 64.85.
WTI Oil Margin Requirement (per lot)
WTI Crude : USD 2805
Mini Crude : USD 1402.5
Join our channels to find out more!
Telegram link:
https://t.me/investorsdoctoracademy
Facebook link: https://m.facebook.com/investorsdoctoracademy
More articles on WTI Crude Oil Updates
Daily Futures Commentaries: [WTI Crude Oil] 31/12/2019 -Sideway to higher , wait for breakout
Created by InvestorsDoctor | Dec 31, 2019
Daily Futures Commentaries: [WTI Crude Oil] 18/12/2019 - Watch out for weekly stock data
Created by InvestorsDoctor | Dec 18, 2019
Daily Futures Commentaries: [WTI Crude Oil] 17/12/2019 - Watch out for weekly stock data
Created by InvestorsDoctor | Dec 17, 2019
Discussions
Be the first to like this. Showing 0 of 0 comments
Post a Comment
Featured Posts


Latest Videos


Apps


Top Articles
1
Stock Pick Contest Year 2024
2
https://dividendguy67.blogspot.com
3
Koon Yew Yin's Blog
4
5
save malaysia!
6
Mercury Securities Research
7
Good Articles to Share
8
#
Stock
Score
Daily Stocks
Stock Name
Last
Change
Volume
Stock Name
Last
Change
Volume
Stock Name
Last
Change
Volume
MQ Trading Signals
Stock
Time
Signal
Duration
Stock
Time
Signal
Duration
Featured Advertisers / Partners


Ride The Bull Short The Bear
CS Tan
4.9 / 5.0
This book is the result of the author's many years of experience and observation throughout his 26 years in the stockbroking industry. It was written for general public to learn to invest based on facts and not on fantasies or hearsay....