


WTI Crude Oil Updates
Daily Futures Commentaries: [WTI Crude Oil] 14/6/2018 - Oil rises as US inventories fall on strong demand

InvestorsDoctor
Publish date: Thu, 14 Jun 2018, 10:53 AM
InvestorsDoctor
0 1,969
To get more information on local and foreign futures markets, join us on telegram & Facebook.
Join link: https://t.me/investorsdoctoracademy
Facebook: https://m.facebook.com/investorsdoctoracademy/
Join link: https://t.me/investorsdoctoracademy
Facebook: https://m.facebook.com/investorsdoctoracademy/
13/6/2018
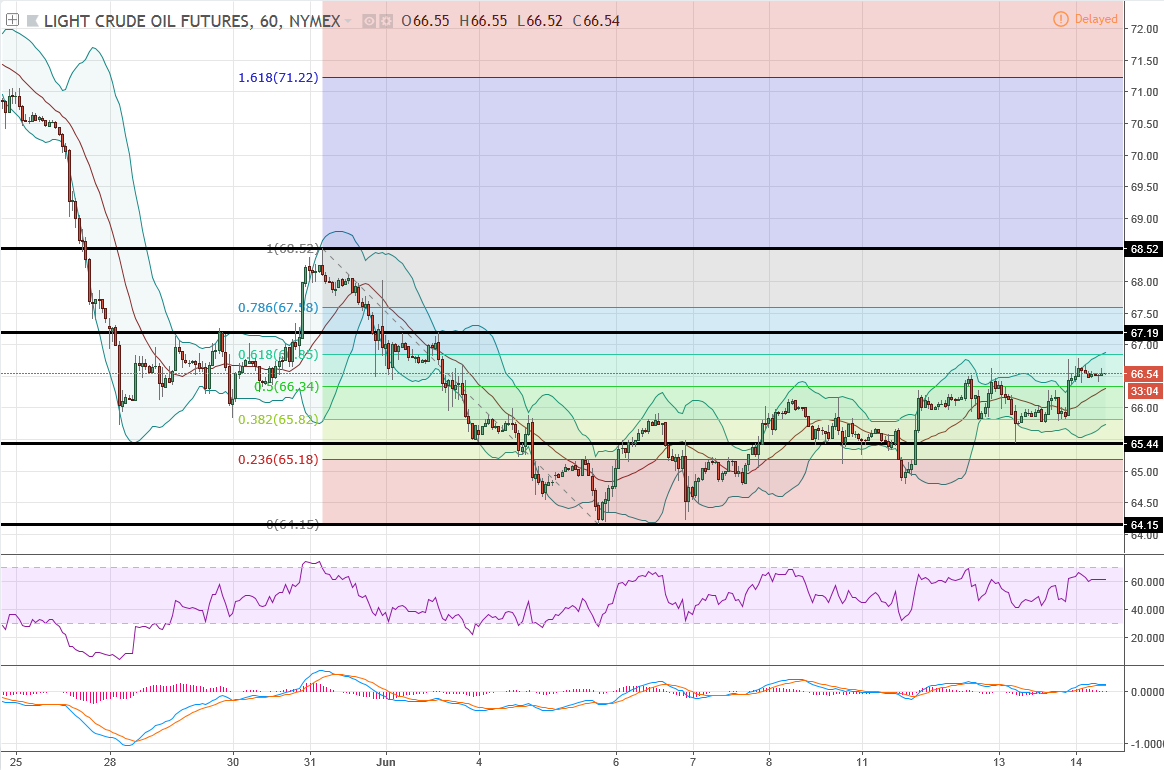
*WTI Crude Oil Aug 18*
Previous Close: 66.52 +0.24
Please be noted that Jul 18 will be expired on 20 June, traders may choose to trade Aug 18 contract. Crude oil up slightly after a bigger than expected decline in crude inventories as reported by EIA.
Both daily & hourly charts show crude oil testing rebound after hit lower lows. Watch out for potential hidden divergence in daily chart if RSI formed lower low while price go higher low.
*Classic Support & Resistance*
Resistance: 67.19 68.52
Support: 65.44 64.15
*Recommend Trading Plan for the day:*
1. Look for buy signal if break above 66.78.
2. Look for sell signal if break below 66.26.
*WTI Oil Margin Requirement (per lot)*
WTI Crude : USD 2805
Mini Crude : USD 1402.5
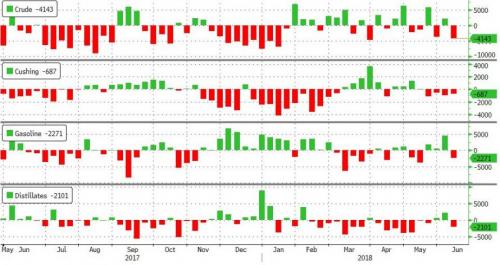
*API*
Crude +833k (-1.25mm exp)
Cushing -730k (-900k exp)
Gasoline +2.33mm
Distillates +2.1mm
*EIA*
Crude -4.143mm (-1.25mm exp) - biggest draw since March
Cushing -687k (-900k exp)
Gasoline -2.271mm (+1mm exp)
Distillates -2.101mm
Join our channels to find out more!
Telegram link:
https://t.me/investorsdoctoracademy
Facebook link: https://m.facebook.com/investorsdoctoracademy
More articles on WTI Crude Oil Updates
Daily Futures Commentaries: [WTI Crude Oil] 31/12/2019 -Sideway to higher , wait for breakout
Created by InvestorsDoctor | Dec 31, 2019
Daily Futures Commentaries: [WTI Crude Oil] 18/12/2019 - Watch out for weekly stock data
Created by InvestorsDoctor | Dec 18, 2019
Daily Futures Commentaries: [WTI Crude Oil] 17/12/2019 - Watch out for weekly stock data
Created by InvestorsDoctor | Dec 17, 2019
Discussions
Be the first to like this. Showing 0 of 0 comments
Post a Comment
Featured Posts


Latest Videos


Apps


Top Articles
1
Stock Pick Contest Year 2024
2
https://dividendguy67.blogspot.com
3
Koon Yew Yin's Blog
4
5
save malaysia!
6
Mercury Securities Research
7
Good Articles to Share
8
#
Stock
Score
Daily Stocks
Stock Name
Last
Change
Volume
Stock Name
Last
Change
Volume
Stock Name
Last
Change
Volume
MQ Trading Signals
Stock
Time
Signal
Duration
Stock
Time
Signal
Duration
Featured Advertisers / Partners


Ride The Bull Short The Bear
CS Tan
4.9 / 5.0
This book is the result of the author's many years of experience and observation throughout his 26 years in the stockbroking industry. It was written for general public to learn to invest based on facts and not on fantasies or hearsay....