


WTI Crude Oil Updates
Daily Futures Commentaries: [WTI Crude Oil] 27/6/2018 - Hit 1 month high at above 70 after surprise decrease in API weekly crude inventories

InvestorsDoctor
Publish date: Wed, 27 Jun 2018, 10:47 AM
InvestorsDoctor
0 1,969
To get more information on local and foreign futures markets, join us on telegram & Facebook.
Join link: https://t.me/investorsdoctoracademy
Facebook: https://m.facebook.com/investorsdoctoracademy/
Join link: https://t.me/investorsdoctoracademy
Facebook: https://m.facebook.com/investorsdoctoracademy/
27/6/2018
*WTI Crude Oil Aug 18*
Previous Close: 70.53 +2.45
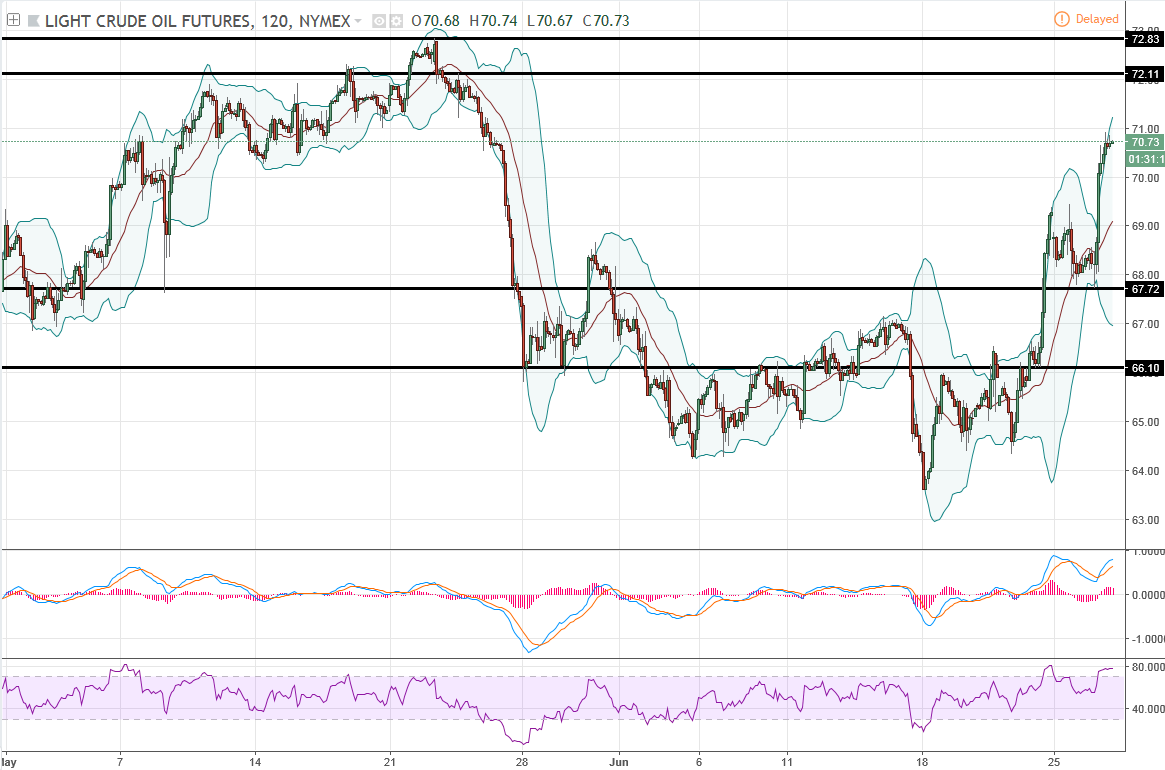
Oil jumped over 2% to hit its 1 month high after API reported a surprising decline in weekly crude oil stocks. Watch out for EIA crude oil inventories tonight at 1030pm.
Daily chart show crude oil sustain above 61.8% Fibo level of previous down swing (72.83-63.59), more to bullish, plus technical indicators testing rebound. Hourly chart show crude oil in RSI overbought, be cautious of potential technical correction in short term.
*Classic Support & Resistance*
Resistance: 72.11 72.83
Support: 67.72 66.10
*Recommend Trading Plan for the day:*
1. Look for buy signal above 70.91.
2. Look for technical correction sell signal below 70.56.
*WTI Oil Margin Requirement (per lot)*
WTI Crude : USD 2805
Mini Crude : USD 1402.5
Join our channels to find out more!
Telegram link:
https://t.me/investorsdoctoracademy
Facebook link: https://m.facebook.com/investorsdoctoracademy
Since 14th May 2018 (stock market reopened after 509 GE-14), FKLI Futures dropped nearly 200.5 points from high 1876.5 to recent low 1676!
Simple Calculation:
200.5 x RM 50 per index point = RM 10,025 (Potential Profit!)
Well, NOW is the time for you to understand more about FKLI Trading!
Come & Join us on 14th July 2018 from 2PM to 4PM at SI Academy.
IDA will discover together with You - What is FKLI............
https://goo.gl/forms/SyxDaLNwkuYagkA02


More articles on WTI Crude Oil Updates
Daily Futures Commentaries: [WTI Crude Oil] 31/12/2019 -Sideway to higher , wait for breakout
Created by InvestorsDoctor | Dec 31, 2019
Daily Futures Commentaries: [WTI Crude Oil] 18/12/2019 - Watch out for weekly stock data
Created by InvestorsDoctor | Dec 18, 2019
Daily Futures Commentaries: [WTI Crude Oil] 17/12/2019 - Watch out for weekly stock data
Created by InvestorsDoctor | Dec 17, 2019
Discussions
Be the first to like this. Showing 0 of 0 comments
Post a Comment
Featured Posts


Latest Videos


Apps


Top Articles
1
Stock Pick Contest Year 2024
2
https://dividendguy67.blogspot.com
3
Koon Yew Yin's Blog
4
5
save malaysia!
6
Mercury Securities Research
7
Good Articles to Share
8
#
Stock
Score
Daily Stocks
Stock Name
Last
Change
Volume
Stock Name
Last
Change
Volume
Stock Name
Last
Change
Volume
MQ Trading Signals
Stock
Time
Signal
Duration
Stock
Time
Signal
Duration
Featured Advertisers / Partners


Ride The Bull Short The Bear
CS Tan
4.9 / 5.0
This book is the result of the author's many years of experience and observation throughout his 26 years in the stockbroking industry. It was written for general public to learn to invest based on facts and not on fantasies or hearsay....