


WTI Crude Oil Updates
Daily Futures Commentaries: [WTI Crude Oil] 1/8/2018 - Bearish API weekly data & Reuters' OPEC production survey pushed down price

InvestorsDoctor
Publish date: Wed, 01 Aug 2018, 12:03 PM
InvestorsDoctor
0 1,969
To get more information on local and foreign futures markets, join us on telegram & Facebook.
Join link: https://t.me/investorsdoctoracademy
Facebook: https://m.facebook.com/investorsdoctoracademy/
Join link: https://t.me/investorsdoctoracademy
Facebook: https://m.facebook.com/investorsdoctoracademy/
1/8/2018
WTI Crude Oil Sept 18
Previous Close: 68.76 -1.37
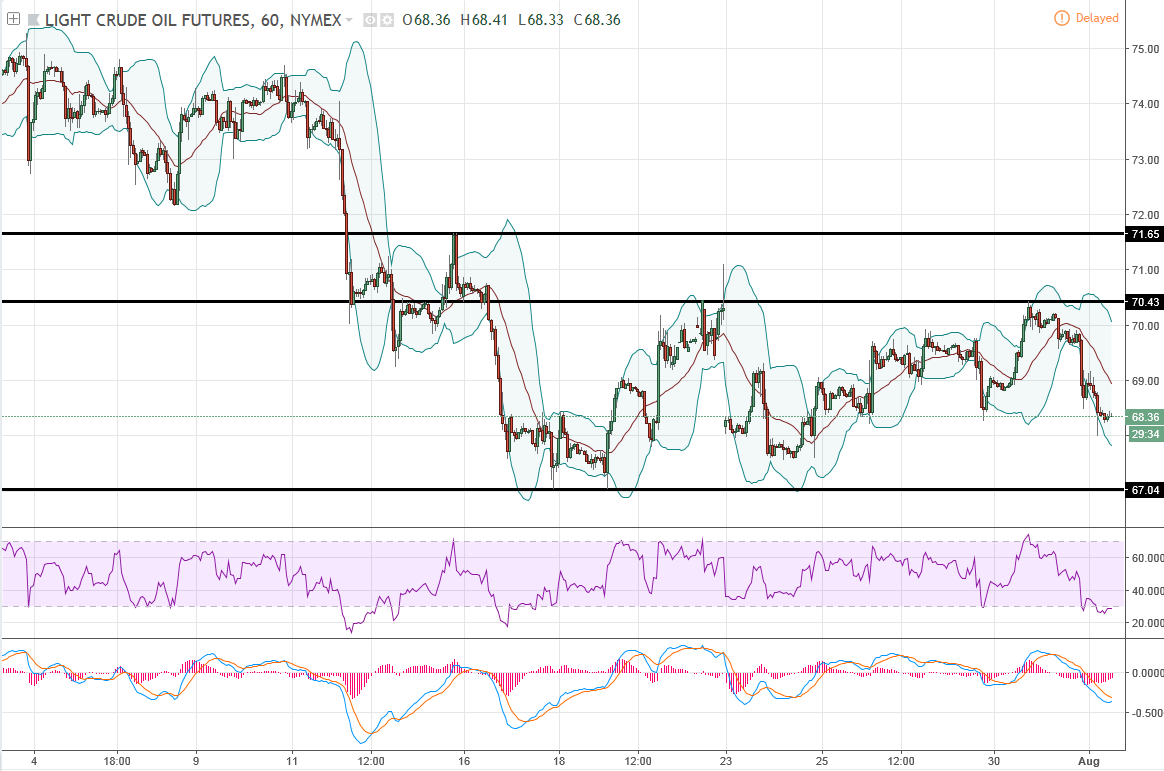
Oil fell on yesterday and closed with largest monthly decline in 2 years after a Reuters survey showed that OPEC production increased to 2018 high in July and as API showed a surprise build in weekly crude oil stock. Watch out for EIA weekly crude oil stock at 1030pm tonight.
Daily chart showed crude oil entered into a technical correction in a bull rally after a RSI bearish divergence. Hourly chart showed crude oil still moving in a sideway, wait for breakout.
Classic Support & Resistance
Resistance: 70.43 71.65
Support: 67.04 65.71
Recommend Trading Plan for the day:
1. Buy 68.53 for technical rebound, stop 68.37, profit 68.69/68.85.
2. Look for sell signal below 67.99.
WTI Oil Margin Requirement (per lot)
WTI Crude : USD 3795
Mini Crude : USD 1897.50
Disclaimer: Idea sharing only, trade at your own risk.
Join our channels to find out more!
Telegram link:
https://t.me/investorsdoctoracademy
Facebook link: https://m.facebook.com/investorsdoctoracademy

Register Now! Click the link below:
https://goo.gl/forms/g1DZeOIAyw7KNsFt2
Register Now! Click the link below:
https://goo.gl/forms/g1DZeOIAyw7KNsFt2
More articles on WTI Crude Oil Updates
Daily Futures Commentaries: [WTI Crude Oil] 31/12/2019 -Sideway to higher , wait for breakout
Created by InvestorsDoctor | Dec 31, 2019
Daily Futures Commentaries: [WTI Crude Oil] 18/12/2019 - Watch out for weekly stock data
Created by InvestorsDoctor | Dec 18, 2019
Daily Futures Commentaries: [WTI Crude Oil] 17/12/2019 - Watch out for weekly stock data
Created by InvestorsDoctor | Dec 17, 2019
Discussions
Be the first to like this. Showing 0 of 0 comments
Post a Comment
Featured Posts


Latest Videos


Apps


Top Articles
1
Stock Pick Contest Year 2024
2
https://dividendguy67.blogspot.com
3
Koon Yew Yin's Blog
4
5
save malaysia!
6
Mercury Securities Research
7
Good Articles to Share
8
#
Stock
Score
Daily Stocks
Stock Name
Last
Change
Volume
Stock Name
Last
Change
Volume
Stock Name
Last
Change
Volume
MQ Trading Signals
Stock
Time
Signal
Duration
Stock
Time
Signal
Duration
Featured Advertisers / Partners


Ride The Bull Short The Bear
CS Tan
4.9 / 5.0
This book is the result of the author's many years of experience and observation throughout his 26 years in the stockbroking industry. It was written for general public to learn to invest based on facts and not on fantasies or hearsay....