HLBANK: Setting Its Sight On All Time High (Uptrend but Overbought) - KingKKK
KingKKK
Publish date: Thu, 29 Aug 2024, 02:29 PM

Moving Averages:
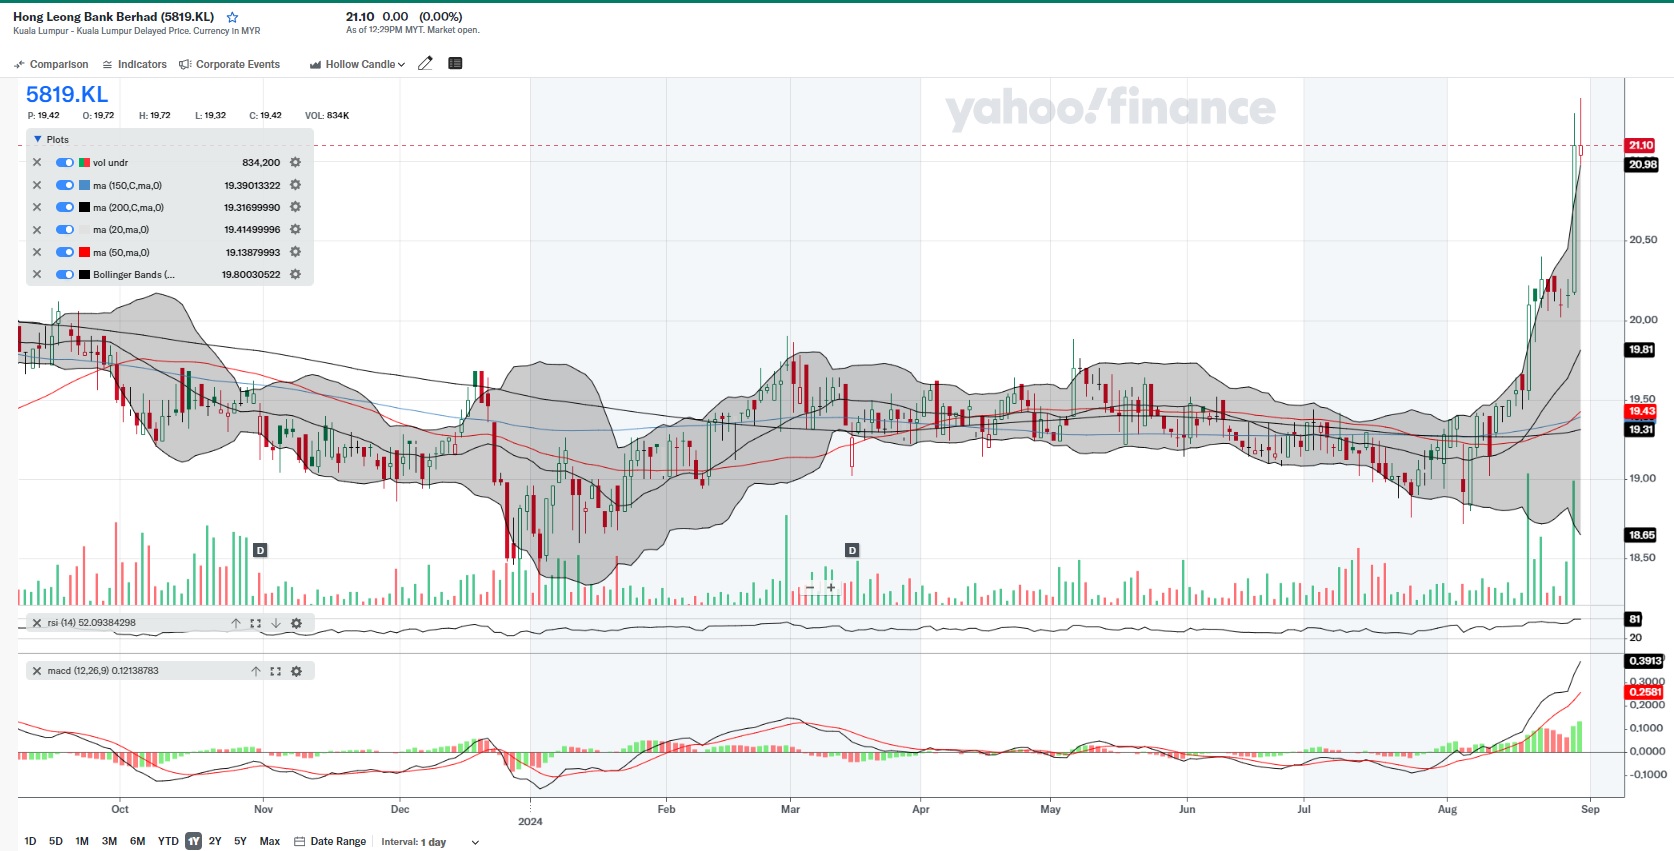
The stock price is well above all the moving averages (50, 150, and 200-day), which is a strong bullish sign. The moving averages are also aligned correctly (shorter-term above longer-term), indicating a strong uptrend.
Bollinger Bands:
The stock price is touching the upper Bollinger Band, which typically suggests that the stock might be overbought in the short term. However, in a strong uptrend, prices can stay at or near the upper band for an extended period.
Relative Strength Index (RSI):
The RSI is at 82, which is in the overbought territory. This can signal that a pullback or consolidation may be expected soon. However, in strong uptrends, stocks can remain overbought for extended periods.
MACD (Moving Average Convergence Divergence):
The MACD is well above the signal line, indicating strong bullish momentum. The histogram also shows increasing positive momentum, which supports the continuation of the uptrend.
Volume:
There has been a significant increase in volume, confirming the strong upward price movement. Higher volume on up moves generally indicates strong buying interest.
LATEST FUNDAMENTAL NEWS - on 29-Aug-2024
1. Net profit was up 3.1% to RM3.44 billion. Hong Leong Bank's FY2024 net profit after tax increased by 9.9% against FY2023 to RM4.20 billion.
2. The Group's gross loans and financing has increased 7.3% against FY2023 to RM194.9 billion. This shows that the growth trend is sustained.
3. The company announced a final dividend of 43 sen dividend (+13% against 38 sen last year).
DETAILS
More articles on Stock Market Enthusiast
Created by KingKKK | Aug 30, 2024
Created by KingKKK | Aug 30, 2024
Created by KingKKK | Aug 29, 2024
Created by KingKKK | Aug 28, 2024
Created by KingKKK | Aug 27, 2024
Created by KingKKK | Aug 27, 2024


.png)


