Technical Analysis - INARI AMERTRON BERHAD
kltrader
Publish date: Wed, 30 Nov 2022, 05:18 PM

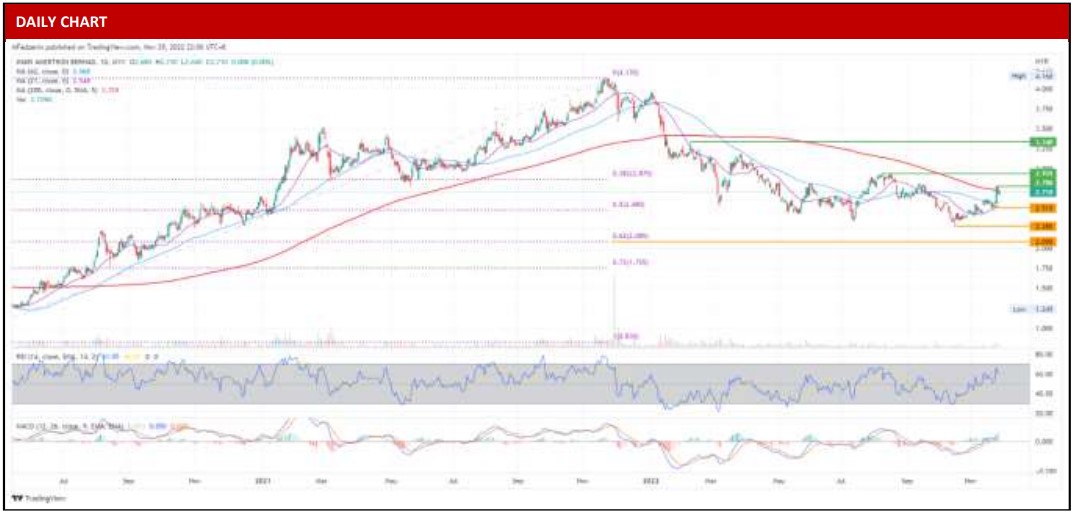
On the Daily Chart, INARI AMERTON BERHAD (INARI) has been trading in a long-term downward trend as it travels below its 200-day simple moving average since January 2022. However, recent price action suggested a continuation of a resilient mid-term trend, as it outperformed the 21 and 62-day simple moving averages. This is followed by the positive Relative Strength Index (RSI) and Moving Average Convergence Divergence (MACD) indicators, which validate that the bullish rally is still intact in the near term. We think the price may challenge the 200-day simple moving average (SMA) of 2.72 again soon. Breaking and holding above 2.72 might send prices soaring to the next resistance level at 2.93. Otherwise, should the price fail to stay over 2.72, this would be a sign of a reversal and would increase the chances of a return to the 1st support of 2.51. Our research house has a fundamental BUY call on INARI with a target price of RM 3.75.
Source: BIMB Securities Research - 30 Nov 2022
Related Stocks
| Chart | Stock Name | Last | Change | Volume |
|---|
More articles on Bimb Research Highlights
Created by kltrader | Nov 12, 2024
Created by kltrader | Nov 11, 2024
Created by kltrader | Nov 11, 2024
Created by kltrader | Nov 11, 2024


