Technical Analysis - KOSSAN RUBBER INDUSTRIES BERHAD
kltrader
Publish date: Mon, 20 May 2024, 04:49 PM

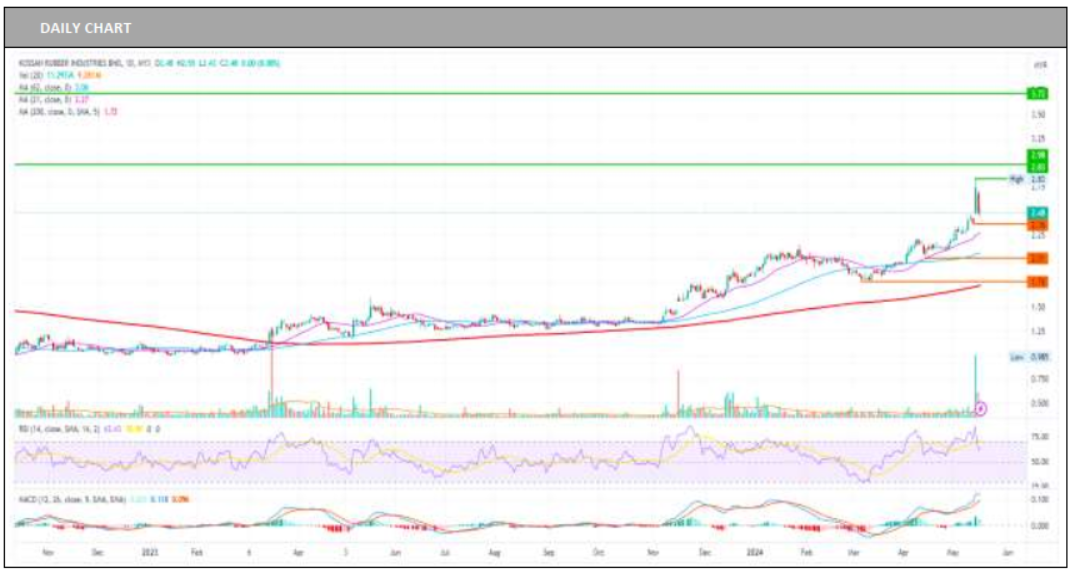
On the daily chart, KOSSAN RUBBER INDUSTRIES BERHAD (KOSSAN) is displaying strong bullish signals, currently trading at 2.48. The stock has recently had a strong rally and is now firmly positioned above its key moving averages. The price is trading well above the 200 SMA (1.72), 62 SMA (2.06), and 21 SMA (2.27), confirming the strength of the ongoing uptrend. The RSI stands at 62.43, indicating bullish momentum, but it is declining from the overbought zone, suggesting that profit-taking activity is prevailing. The MACD is also bullish with a value of 0.118, reflecting continued upward momentum as it stays above the signal line. Despite the recent knee-jerk uptick in market sentiment, we believe the buying sentiment has been weakening and may potentially test the support level at 2.36. A successful breach below this level could amplify the bearish momentum, potentially leading to a retest of support at 2.01. Conversely, failure to breach the key support at 2.36 could trigger a rebound, with the nearest resistance level residing at 2.83. Our research house maintains a SELL call on KOSSAN with a target price of RM1.33.
Source: BIMB Securities Research - 20 May 2024
Related Stocks
| Chart | Stock Name | Last | Change | Volume |
|---|
More articles on Bimb Research Highlights
Created by kltrader | Jan 13, 2025


