Technical Analysis - MISC BERHAD
kltrader
Publish date: Wed, 17 Jul 2024, 05:55 PM

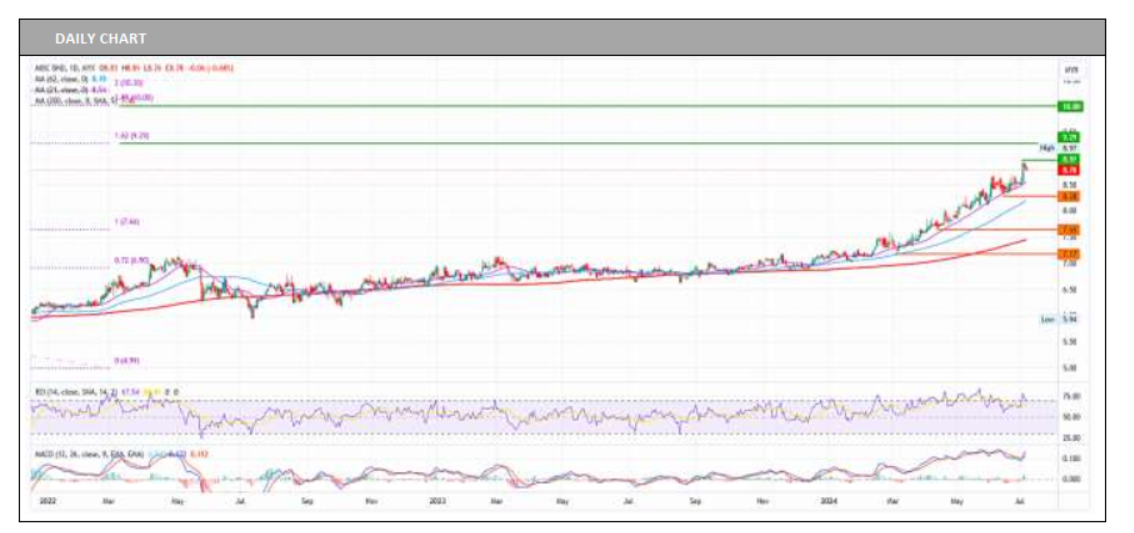
On the daily chart, MISC BERHAD (MISC) continues to show a prevailing positive bias, trading above all the Moving Averages (MA). This is supported by a positive Moving Average Convergence Divergence (MACD) and the Relative Strength Index (RSI), which indicates a bullish sentiment with increased buying pressure as it moves above the midpoint and approaches overbought territory. Anticipated price action suggests MISC may test the resistance level at 8.97. A successful breakout above this level could sustain the bullish momentum, possibly leading to a retest of resistance at 9.29. Conversely, failure to surpass the 8.97 resistance may result in a pullback, with the nearest support level at 8.28. Our research house recommends a BUY call on MISC, with a target price of RM10.30.
Source: BIMB Securities Research - 17 Jul 2024
Related Stocks
| Chart | Stock Name | Last | Change | Volume |
|---|
More articles on Bimb Research Highlights
Created by kltrader | Jan 13, 2025


