


Bimb Research Highlights
Technical Analysis - HIBISCUS PETROLEUM BERHAD

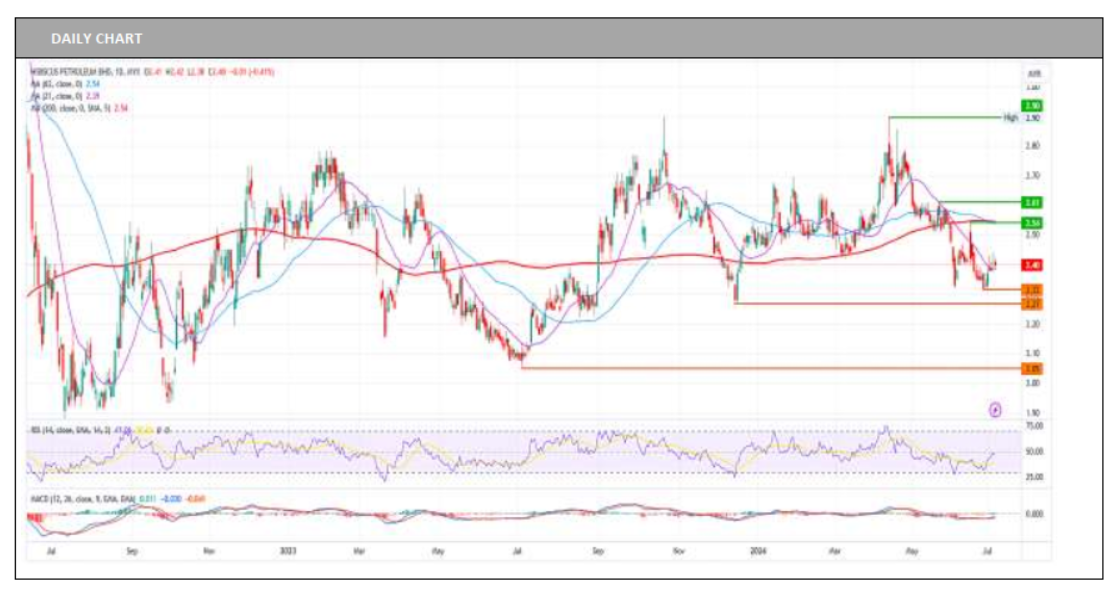
On the daily chart, HIBISCUS PETROLEUM BERHAD (HIBISC) is currently exhibiting a bearish technical profile. The RSI's position below the midpoint indicates selling pressure, and the negative MACD value signals a downtrend in momentum. All moving averages are above the current price, suggesting the stock is trading below key long-term and short-term averages, which could act as dynamic resistance. Market sentiment anticipates HIBISC's price potentially testing the support level at 2.32. A successful breach below this level could amplify the bearish momentum, potentially leading to a retest of support at 2.27. Conversely, failure to breach the critical support at 2.32 could trigger a rebound, with the nearest resistance level at 2.54. Our research house has a BUY call on HIBISCS with a target price of RM3.40.
Source: BIMB Securities Research - 17 Jul 2024
More articles on Bimb Research Highlights
Economic - Sarawak’s Budget 2025 – Together Building a Prosperous Future
Created by kltrader | Nov 12, 2024
Economic - Manufacturing Sector on Track for Recovery Despite Slowdown
Created by kltrader | Nov 11, 2024
Economic - Sarawak’s Budget 2025 – Another Booster for Construction Sector
Created by kltrader | Nov 11, 2024
Malaysia Building Society Berhad - Navigating Challenges Price Chart (RM)
Created by kltrader | Nov 11, 2024
Discussions
Be the first to like this. Showing 0 of 0 comments
Post a Comment
Featured Posts
Introducing MY's First IPO Fund for Sophisticated Investors!
New Update. Discover investment communities that resonate with your ideas
M & A Value Partners IPO Equity Fund has been launched - Targeted 13% Return p.a
Latest Videos


Apps


Top Articles
1
2
Good Articles to Share
3
4
Koon Yew Yin's Blog
Why all plantation companies will continue to report more profit - Koon Yew Yin
5
AmInvest Research Reports
6
7
save malaysia!
8
#
Stock
Score
Daily Stocks
Stock Name
Last
Change
Volume
Stock Name
Last
Change
Volume
Stock Name
Last
Change
Volume
MQ Trading Signals
Stock
Time
Signal
Duration
Stock
Time
Signal
Duration
Featured Advertisers / Partners


Ride The Bull Short The Bear
CS Tan
4.9 / 5.0
This book is the result of the author's many years of experience and observation throughout his 26 years in the stockbroking industry. It was written for general public to learn to invest based on facts and not on fantasies or hearsay....