


Find and buy depressed stocks, but avoid value trap.
Furniture / wood product export sector – Time for rebound / better appreciation?

Background:

1. All have depressed valuation – trading at below NAPS or relatively low P/E.
2. Liihen & Homeriz is deploying their capital better – delivering better ROE than others.
3. Estimated per Statista in FY2021, global furniture market = USD 528b, US furniture market = USD 230b. US furniture market is 44% of world market. Hence, performance of the US market has directly impact on performance on most of the furniture counters.
Why is the furniture / wood product export sector share prices so depressed?

1. -ve CAGR for Rev and PAT from FY2019 to FY2023 (except Homeriz – could be due to less reliance on the US market compared to peers).
2. -ve CAGR for Rev and PAT from FY2022 to FY2023 for all.
3. Pessimism from institutional investors and institutional analysts: Low TPs for Homeriz, Liihen & Po Huat with basis of PE6.5x-9x by PB, HLG and TA.
4. Depressed furniture markets arising from elevated global interest rates reducing housing affordability and dampening housing transactions – hence reducing purchases of new furniture. (US Fed Rate: 5.5%, US average mortgage rates: 6.88%; Euro Area: 4.5%).
Elevated mortgage rates:
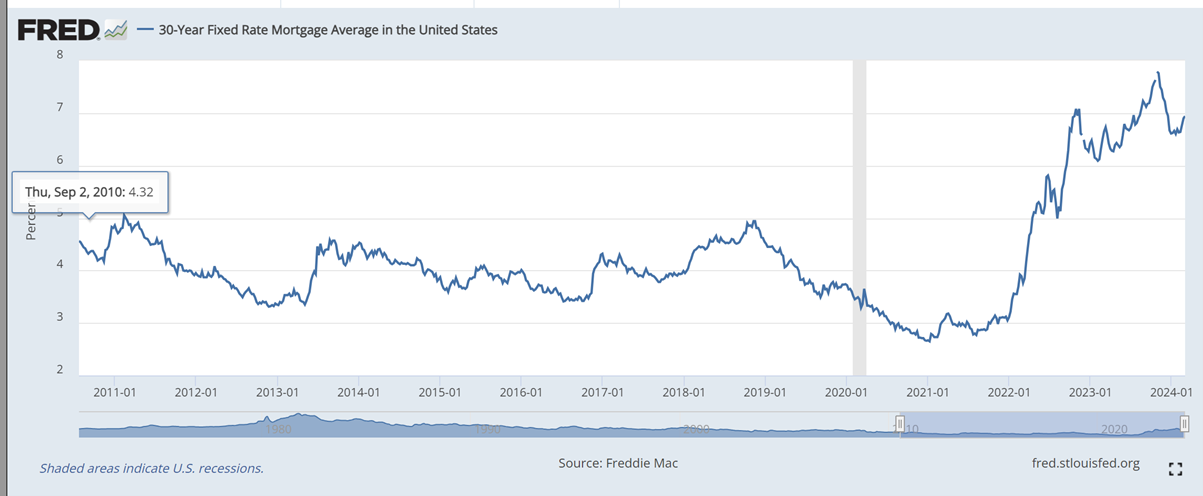
1. We can see that mortgage rates are at record levels (in fact higher than previous 24 years).
2. After a reaching a peak of 7.79% in October 2023, it dropped, before rising again. Markets were expecting the Fed to reduce interest rates as inflation fell to 3.1% as of March 2024, but the Fed did not, hence the rising mortgage rates again.
3. Latest US Q4 2023 GDP growth of 3.2%, and unemployment at Feb 2024 at 3.9%.
4. Given (2) and (3) above, and with the Fed’s mandate of maximum unemployment and inflation target of 2%, most likely Fed would tread reducing Fed rates cautiously – Fed could gradually reduce rates this year, but strong economy and still above mandate inflation mean a lack of urgency to drop rates immediately.
The dampened US housing transactions:
Diagram 1
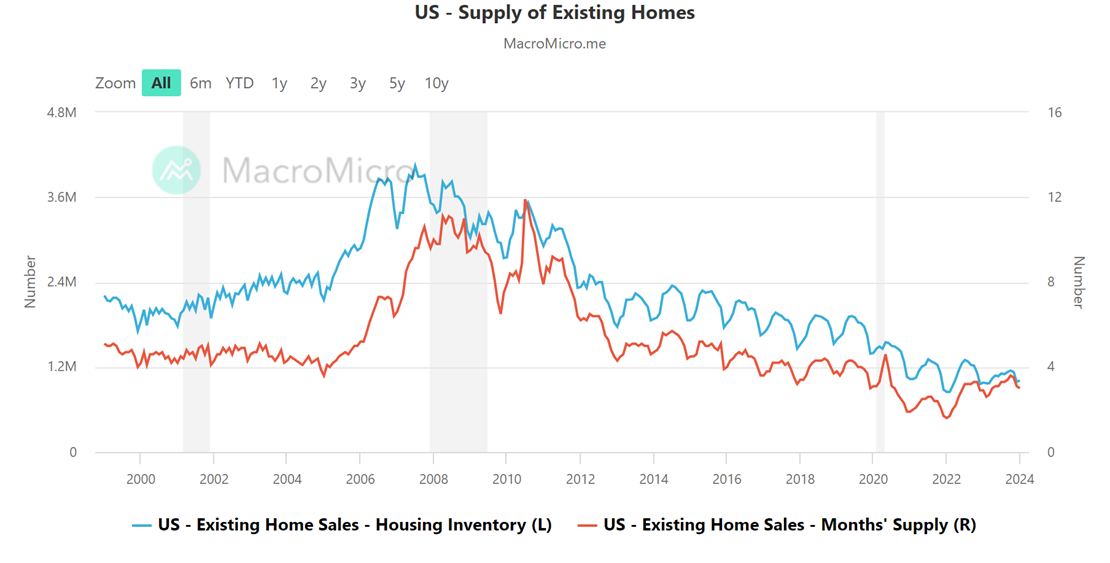
Diagram 2
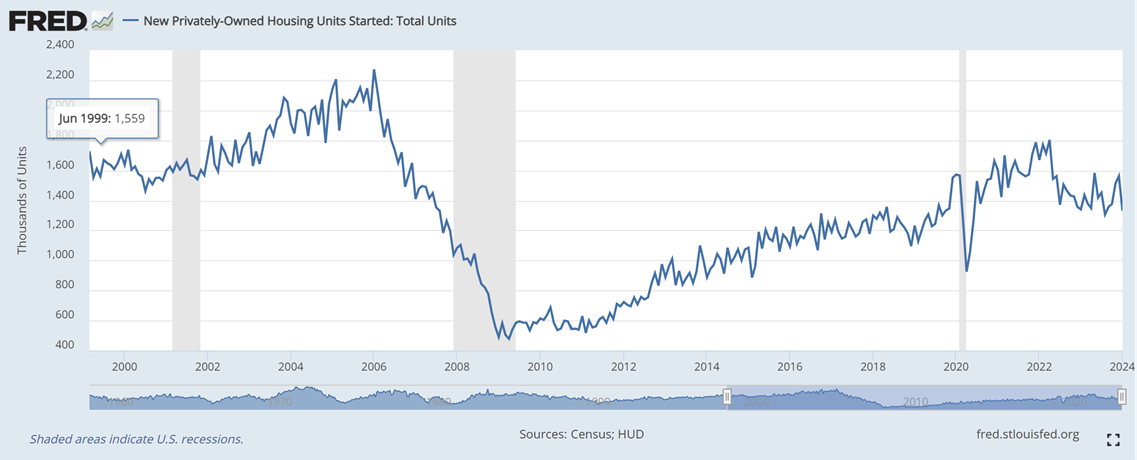
Diagram 3

1. Existing home sales inventory has not recovered to pre-covid level: Supply is at record low. Combined with record low of 1.6-4.0 (Diagram 1) existing home sales months’ supply, demand is holding up, likely due to increased population and demographics reaching point of homebuying. Y-o-Y Jan 2024 median price increase by 5.1% (REDFIN). This is still a sellers’ market.
2. High mortgage rates:
a. Sellers not willing to sell and upgrade, because not willing to give up previous locked low fixed rate, and not willing to scout for upgrade houses in this shortage market. Main cause of record low inventory.
b. Combination of high prices from housing shortage and high mortgage rates have severely affected affordability of potential home buyers.
3. Existing home prices are sticky – existing home sellers factor in emotion and mostly have only a home and willing to wait out to sell for maximum prices. Combined with unaffordability from 2(b) above – existing homes months’ supply inched up from 1.6 (Jan 22) to 3.0 (Jan 24). This means there is still a severe shortage, and prices are still holding up but liquidity and number of transactions of reduced.
4. New housing starts (defined by when construction started) recovered to before pre-covid level or even higher in certain periods (Diagram 2) – but still lower than pre-global financial crisis. Also surprisingly, its months’ supply, after a plunge during covid, went up to higher than pre-covid level (Diagram 3 – 8.3 months at Jan 2024).
(“New Versus Existing U.S. Home Prices: Why the Divergence? – Admir Kolaj” source of info for 5, 6 and 7)
5. In fact, new housing starts average prices dipped below average prices of existing home sales – historically new homes commanded 16% premium on average over existing home sales.
6. Likely factors leading to (4) and (5) above – tight supply and higher home prices led builders to construct more homes. Economic reopening post-covid meant more workers went back to working in office – generating preference to existing home sales with generally more central location than new housing. Hence, the divergences in price, inventory and months’ supply.
7. But, builders tend to be not sticky in terms of selling new homes. Their goal of maximising profits is a balance between selling price and holding inventory – not necessary selling highest price because it would increase inventory cost. New housing stock now makes up a third of the entire pool of housing stock. (<15% in the past). This has incentivised builders to offer lower prices, discounts, and incentives.
TL;DR
1. The US market dominates the world furniture market (44% of world market).
2. The US furniture market is highly contingent on home sales and less on commercial property transactions. (US total housing value = USD52T; US total commercial property value = USD22T). Source below.
3. We don’t know when US Fed would reduce rates – but given the Fed’s mandates and the needs of the US economy, the most likely scenario is Fed would cautiously reduce rates, and the process could be gradual and slow.
4. In the existing home sales market, the market is becoming less liquid, because of shortages, sticky high prices and increasing unaffordability from high mortgage rates.
5. The higher prices likely spurred builders to increase and stabilise new housing starts – some have even started to offer discounts and incentives to drive affordability.
The trend and scenarios moving forward would likely be:
1. Continued incentives from new home builders to slow price increases, drive affordability and increase transactions to offset the shortages in the existing home sales market. So, the shortages would most likely not worsen and the situation could improve.
2. Mortgage rates would likely remain persistently high for some time, and any reduction would be gradual. Any improvement to affordability would be marginal.
3. A housing crash is unlikely. Housing stock and housing months’ supply is still much lower than during the global financial crisis or before, and this is combined with the increased US population. Regulations are much stronger now also, with considerable lesser subprime mortgage loan. Home equity ownership among homeowners are much higher also.
Given the above housing market, the furniture sector shares would have limited to no downside. However, improvement would be gradual and a spike is unlikely bar any unexpected event.
Liihen and Homeriz would be the best pick to participate for this medium-term upside, considering better return and use of assets. For Po Huat and RKI, the huge cash could be an impediment for efficient use of asset and returns – unless management finds avenues to deploy this cash.
Source:
2. https://www.rer.org/wp-content/uploads/CRE-By-The-Numbers.pdf
Related Stocks
| Chart | Stock Name | Last | Change | Volume |
|---|
Discussions
1 person likes this. Showing 3 of 3 comments
Your analysis doesnt say how can we compete with thailand and vietnam. From what i know they are a lot more competitive
2024-03-11 14:01
According to Furniture Today, the top furniture exporting countries to the US are
1. Vietnam, US$9.7b,
2. China, US$8.5b
3. Mexico, US$2.3b
4. Malaysia,US$1.571b
5. Canada, US$1.546b
6. Indonesia
7. Italy
8. India
9. Thailand, US$593m
10. Poland
Pohuat has factories in Vietnam. But in recent years it has not been doing as well as Liihen which is solely located in Malaysia
2024-03-11 16:18
Post a Comment
Featured Posts
Introducing MY's First IPO Fund for Sophisticated Investors!
New Update. Discover investment communities that resonate with your ideas
M & A Value Partners IPO Equity Fund has been launched - Targeted 13% Return p.a
Latest Videos


.png)


Apps


Top Articles
1
Stock Pick Contest Year 2024
2
https://dividendguy67.blogspot.com
3
Koon Yew Yin's Blog
5
6
7
BFM Podcast
8
Stock Market Enthusiast
CIMB: Uptrend Continues - Is the Best Yet to Come? (Uptrend + Bullish) - KingKKK
#
Stock
Score
Daily Stocks
Stock Name
Last
Change
Volume
Stock Name
Last
Change
Volume
Stock Name
Last
Change
Volume
Featured Advertisers / Partners


Ride The Bull Short The Bear
CS Tan
4.9 / 5.0
This book is the result of the author's many years of experience and observation throughout his 26 years in the stockbroking industry. It was written for general public to learn to invest based on facts and not on fantasies or hearsay....
observatory
Very impressive analysis!
BTW you may want to update Diagram 3, which was wrongly pasted as duplicate of Diagram 2.
I have a few questions.
1. Could Statista’s data which shows 44% of global furniture market is in US be flawed? Even focusing on just developed world, US population of 330m is still less than 30% of the developed world population of 1.2 billion.
2. Could some Malaysian exporters have heavier exposure to US than indicated? Liihen used to classify some customers as Asia but they were resellers to the US end market.
3. Do you follow up on US furniture sales and inventory situation? If yes what is the company/ industry data that you rely on as leading indicators of furniture demand? What is the current situation?
2024-03-11 12:34