


Bursa Malaysia Stock Watch
Why We Look at the PEG Ratio

kltrader
Publish date: Sun, 08 Aug 2010, 11:56 PM
kltrader
0 20,639
This blog provides consolidated Bursa Malaysia stock market research, analysis, news and blogs from various sources. You can search and find all the past analysis and coverage on stocks and news by searching within this site. While this blog re-publishes contents from other sites, it does not own the rights nor responsible for the accuracy of the contents. If you disagree to your content from being published here, please add a comment, and your article will be removed from this site.


Why We Look at the PEG Ratio
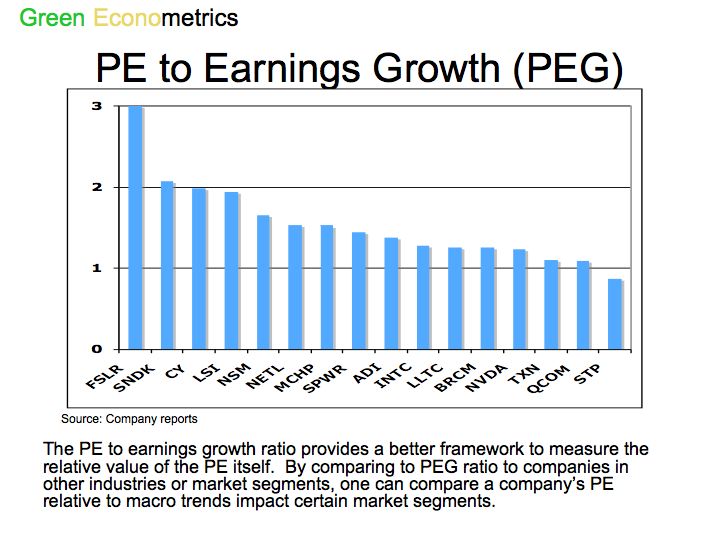
One of the more popular ratios stock analysts look at is the P/E, or price to earnings, ratio. The drawback to a P/E ratio is that it does not account for growth. A low P/E may seem like a positive sign for the stock, but if the company is not growing, its stock's value is also not likely to rise. The PEG ratio solves this problem by including a growth factor into its calculation. PEG is calculated by dividing the stock's P/E ratio by its expected 12 month growth rate.
One of the more popular ratios stock analysts look at is the P/E, or price to earnings, ratio. The drawback to a P/E ratio is that it does not account for growth. A low P/E may seem like a positive sign for the stock, but if the company is not growing, its stock's value is also not likely to rise. The PEG ratio solves this problem by including a growth factor into its calculation. PEG is calculated by dividing the stock's P/E ratio by its expected 12 month growth rate.
For more information on utilizing the PEG ratio, visit Learning Markets.
How to Score the PEG Ratio
- Pass?Give the PEG Ratio a passing score if its value is less than 1.0.
- Fail?Give the PEG Ratio a failing score if its value is greater than 1.0.
Looking at the PEG ratio for WMT in above chart, WMT should receive a failing score. You can see that the PEG Ratio is above 1.0.
PEG Ratio: FAIL
Read more: http://www.nasdaq.com/reference/dozen/peg-ratio.aspx#ixzz0w08v7wfA
PEG Ratios
Other examples


More articles on Bursa Malaysia Stock Watch
Tambun Indah - The 2nd Penang Bridge To Narrow Property Price Gap
Created by kltrader | Oct 11, 2012
Plantation ' Share Prices Not Reflecting CPO Price Movement ' Is A Correction Coming? (Neutral)
Created by kltrader | Oct 11, 2012
Discussions
Be the first to like this. Showing 0 of 0 comments
Post a Comment
Featured Posts
Introducing MY's First IPO Fund for Sophisticated Investors!
New Update. Discover investment communities that resonate with your ideas
M & A Value Partners IPO Equity Fund has been launched - Targeted 13% Return p.a
Latest Videos


Apps


Top Articles
2
3
4
save malaysia!
Visa-free travel to China extended for Malaysians to 30 days
5
6
Koon Yew Yin's Blog
CPO price is rising rapidly as shown by chart below - Koon Yew Yin
7
Axcapital's investment blog
KAB - Executing its way to a record quarter. Could more Petronas contracts be coming?
8
BFM Podcast
#
Stock
Score
Daily Stocks
Stock Name
Last
Change
Volume
Stock Name
Last
Change
Volume
Stock Name
Last
Change
Volume
MQ Trading Signals
Stock
Time
Signal
Duration
No trading signals available.
Stock
Time
Signal
Duration
No trading signals available.
Featured Advertisers / Partners


Ride The Bull Short The Bear
CS Tan
4.9 / 5.0
This book is the result of the author's many years of experience and observation throughout his 26 years in the stockbroking industry. It was written for general public to learn to invest based on facts and not on fantasies or hearsay....