KJTS Group - Consolidation Is Over?
sectoranalyst
Publish date: Fri, 19 Jul 2024, 09:06 AM

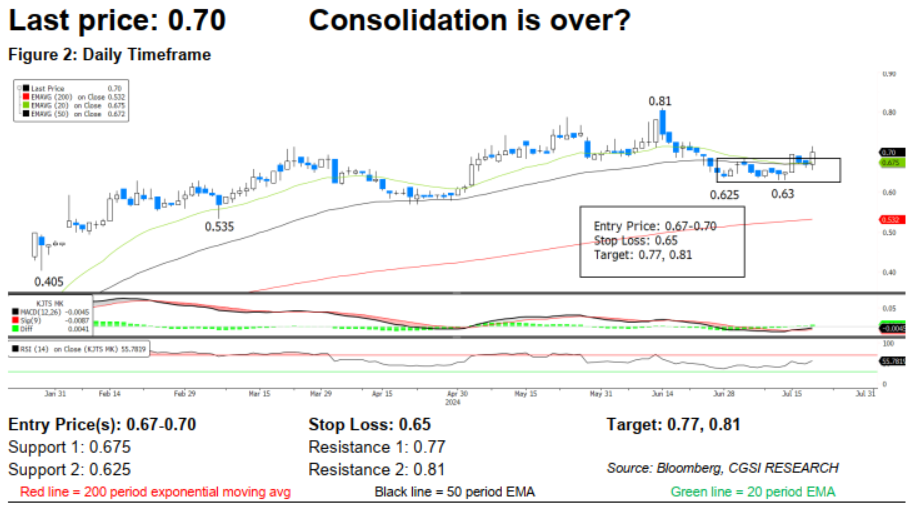
Since its listing, the stock prices has been on the up, forming higher highs and higher lows. The latest pullback from its all-time high of RM0.81 appears to have found a base above RM0.625. There was an upside breakout of its rectangle pattern yesterday, backed by rising volume. Prices are ready to take on its all-time high once more?
Both the Moving Average Convergence Divergence (MACD) and the Relative Strength Index (RSI) have hooked up again, indicating that buying momentum is rising again.
We think that aggressive traders may want to go long here or on weakness with a stop-loss set at RM0.65 (a tick below yesterday’s low). On the upside, prices may push on to test the RM0.77 and the all-time high at RM0.81 next.
Source: CGS-CIMB Research - 19 Jul 2024
Related Stocks
| Chart | Stock Name | Last | Change | Volume |
|---|
More articles on CGS-CIMB Research
Created by sectoranalyst | Jan 13, 2025
Created by sectoranalyst | Dec 11, 2024
Created by sectoranalyst | Sep 27, 2024


