


COMEX Gold Update
Daily Futures Commentaries: [Comex Gold] 30/7/2018 - Continue in sideway after strong US economic data

InvestorsDoctor
Publish date: Mon, 30 Jul 2018, 10:59 AM
InvestorsDoctor
0 1,969
To get timely information on local and foreign futures markets, join us on telegram & Facebook.
Join link: https://t.me/investorsdoctoracademy
Facebook: https://m.facebook.com/investorsdoctoracademy/
Join link: https://t.me/investorsdoctoracademy
Facebook: https://m.facebook.com/investorsdoctoracademy/
30/7/2018
*Gold Dec 18*
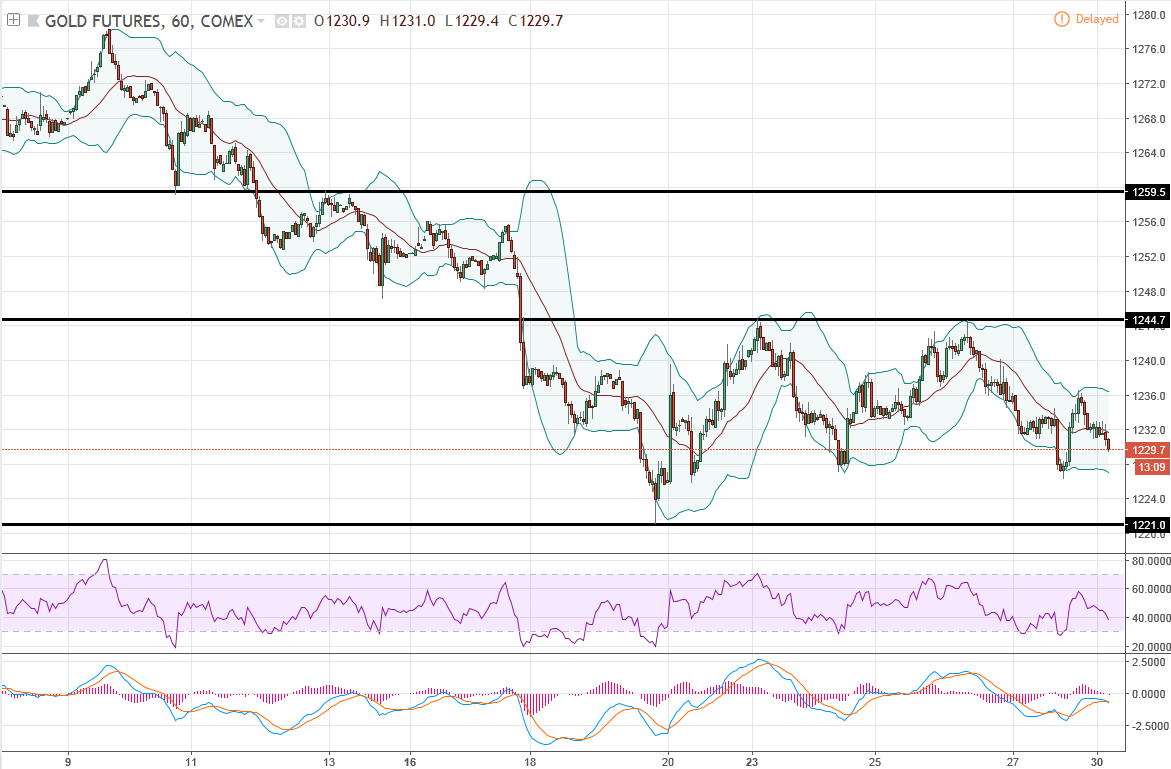
Previous Close: 1232.7 -2.6
Gold slipped slightly last Friday after a strong economic data supported USD.
Daily chart's technical indicators pointed more to downside but testing for a technical rebound from potential RSI bullish divergence. Hourly chart showed gold in a sideway, wait for breakout.
*Classic Support & Resistance*
Resistance: 1244.7 1259.5
Support: 1221 1210
*Recommend Trading Plan for the day:*
1. If price rebound 1st, sell 1229.9, stop 1231.1, profit 1228.7/1227.5.
*Margin Requirement (per lot)*
USD 3410
Micro: USD 341
Disclaimer: Idea sharing only, trade at your own risk.
Join our channels to find out more!
Telegram link:
https://t.me/investorsdoctoracademy
Facebook link: https://m.facebook.com/investorsdoctoracademy

Register Now! Click the link below:
https://goo.gl/forms/g1DZeOIAyw7KNsFt2
Register Now! Click the link below:
https://goo.gl/forms/g1DZeOIAyw7KNsFt2
More articles on COMEX Gold Update
Daily Futures Commentaries: [Comex Gold] 23/12/2019 - Move in range, wait for more breakout
Created by InvestorsDoctor | Dec 23, 2019
Daily Futures Commentaries: [Comex Gold] 20/12/2019 - Move in range, wait for more breakout
Created by InvestorsDoctor | Dec 20, 2019
Daily Futures Commentaries: [Comex Gold] 19/12/2019 - Move in range, wait for more breakout
Created by InvestorsDoctor | Dec 19, 2019
Daily Futures Commentaries: [Comex Gold] 18/12/2019 - Move in range, wait for more breakout
Created by InvestorsDoctor | Dec 18, 2019
Daily Futures Commentaries: [Comex Gold] 17/12/2019 - Move in range, wait for more breakout
Created by InvestorsDoctor | Dec 17, 2019
Discussions
Be the first to like this. Showing 0 of 0 comments
Post a Comment
Featured Posts
Introducing MY's First IPO Fund for Sophisticated Investors!
New Update. Discover investment communities that resonate with your ideas
M & A Value Partners IPO Equity Fund has been launched - Targeted 13% Return p.a
Latest Videos


Apps


Top Articles
1
Stock Pick Contest Year 2024
2
https://dividendguy67.blogspot.com
3
Koon Yew Yin's Blog
4
5
save malaysia!
6
Mercury Securities Research
7
Good Articles to Share
8
#
Stock
Score
Daily Stocks
Stock Name
Last
Change
Volume
Stock Name
Last
Change
Volume
Stock Name
Last
Change
Volume
MQ Trading Signals
Stock
Time
Signal
Duration
Stock
Time
Signal
Duration
Featured Advertisers / Partners


Ride The Bull Short The Bear
CS Tan
4.9 / 5.0
This book is the result of the author's many years of experience and observation throughout his 26 years in the stockbroking industry. It was written for general public to learn to invest based on facts and not on fantasies or hearsay....