


Financial Savvy
KLCI Chart Analysis this week

The benchmark KLCI index gained 59.5 points (3.4%) this week to 1803 compared to 1743.5 last Friday. This was due mainly to global sentiment improvement due to ECB's move to purchase €60 Billion in assets each month starting in March, which was better than market's expectation of €50 Billion.
Lets take a look at Weekly chart first:
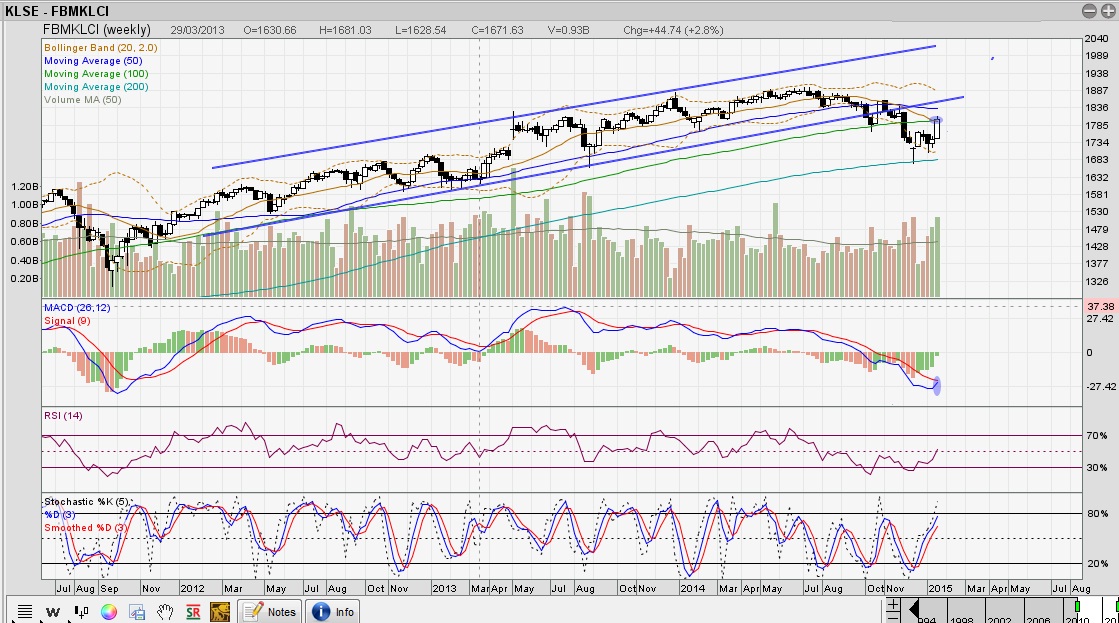
The Candle bar has touched the 100 weeks simple moving average which is a sign market trying to reverse to bullish momentum. MACD cross over has about to happen (almost "kissing" the signal line) indicating yet another uptrend momentum. When looking at the Candle sticks, a resume of bullish trend will only be confirmed once the index resume back into the uptrend channel (the two parallel blue lines zone in chart above). I will expect the back of bullish trend only after the index climbs to 1835 which is also the 50 Week moving average.
Next, on daily chart below, it was a "W" shape chart (a double bottoms), and about to clinch towards the high of the left side of the W. MACD has gone back up to positive line which indicate the start of bull engine. For uptrend to be safely continue, it needs to break the side of left W which is 1822, follow by 1847 which is the next resistance level.
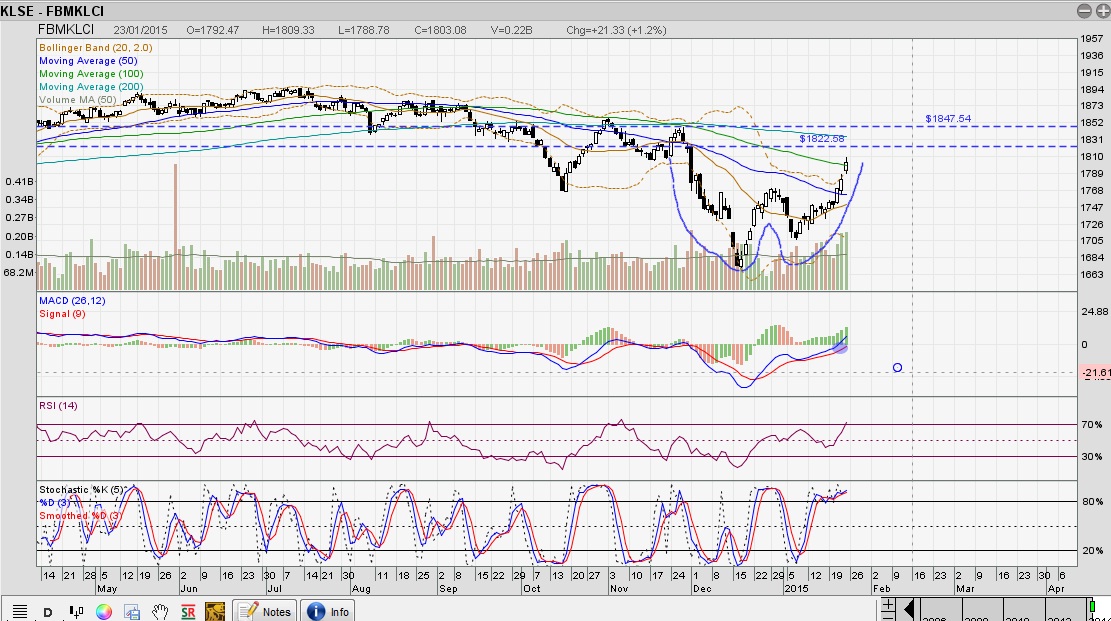
Baring any unforeseen circumstances, I would expect a spill over of the buying interest from Friday to bring the index to test 1835, then 1847 most probably within next week. It is the feel good factor everywhere, and one last thing to expect is the oil price to go up or Ringgit to stablize against USD that could fuel the momentum even further.
For most posts, visit financial savvy website at http://financial-savvy.com
More articles on Financial Savvy
Discussions
Be the first to like this. Showing 0 of 0 comments
Post a Comment
Featured Posts
Introducing MY's First IPO Fund for Sophisticated Investors!
New Update. Discover investment communities that resonate with your ideas
M & A Value Partners IPO Equity Fund has been launched - Targeted 13% Return p.a
Latest Videos


Apps


Top Articles
1
Dragon Leong blog
2
Stock Market Enthusiast
Feng Shui Market Outlook for FBM KLCI in the Year of the Wood Snake (2025)
3
The Alpha Trader
5
Stock Market Enthusiast
3 Resilient Stocks That Defied Malaysia’s Market Slump in January 2025 - #GCB, #ABMB, #CDB
7
MQ Market Updates
8
My Trading Adventure 2025
#
Stock
Score
Daily Stocks
Stock Name
Last
Change
Volume
Stock Name
Last
Change
Volume
Stock Name
Last
Change
Volume
MQ Trading Signals
Stock
Time
Signal
Duration
No trading signals available.
Stock
Time
Signal
Duration
No trading signals available.
Featured Advertisers / Partners


Ride The Bull Short The Bear
CS Tan
4.9 / 5.0
This book is the result of the author's many years of experience and observation throughout his 26 years in the stockbroking industry. It was written for general public to learn to invest based on facts and not on fantasies or hearsay....