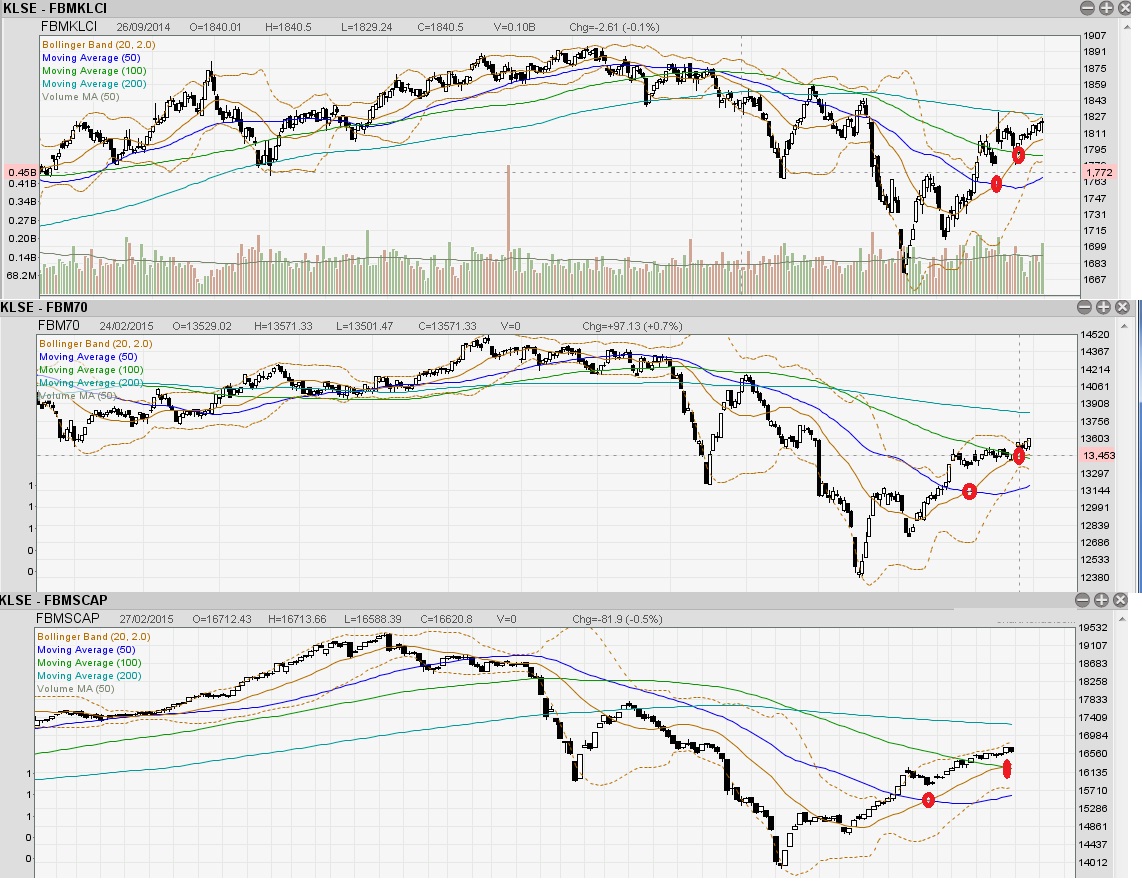
FBMKLCI,FBM70,FBMSCAP Moving Average Summary
hlchang
Publish date: Sat, 28 Feb 2015, 10:15 PM

This week, I am going to look into the charts for FBMKLCI, FBM70, FBMSCAP only from one Technical Indicator's perspective - Moving Average.
As we always know, 20 days moving average indicate short term trend, 50 days and 100 days for medium term, and 200 days for long term. Interestingly, all the 3 charts have shown 20 days moving average crossed over 50 days, and crossing over 100 days too. They have shown some good rallies over the past weeks with FBMKLCI testing the 1820 immediate resistance once again.
All these charts exhibit a common pattern, i.e. they bottomed in around end December and slowly gained back the losses but are still quite some way to go before reaching the early November level. Long term perspective is still cautious especially with the weak Ringgit, and low oil price. The effects have been seen with disappointing results for last quarter for companies such as Petronas, Airasia, Airasia X, IOICorp. A lot of big caps are facing challenging time ahead not only on falling oil prices for oil players but also with weakening Ringgit, companies that are having foreign borrowing are facing losses from foreign exchange. Examples of these companies are IOICorp, AAX, and Airasia.
In short, on the moving average, it looks like the indices are having a positive trend with short term and medium term. Long term trend are not back to bullish yet and would likely seeing some challenges amid global oil price and weaker Ringgit.
For more info, visit financial-savvy.com.
Related Stocks
| Chart | Stock Name | Last | Change | Volume |
|---|


