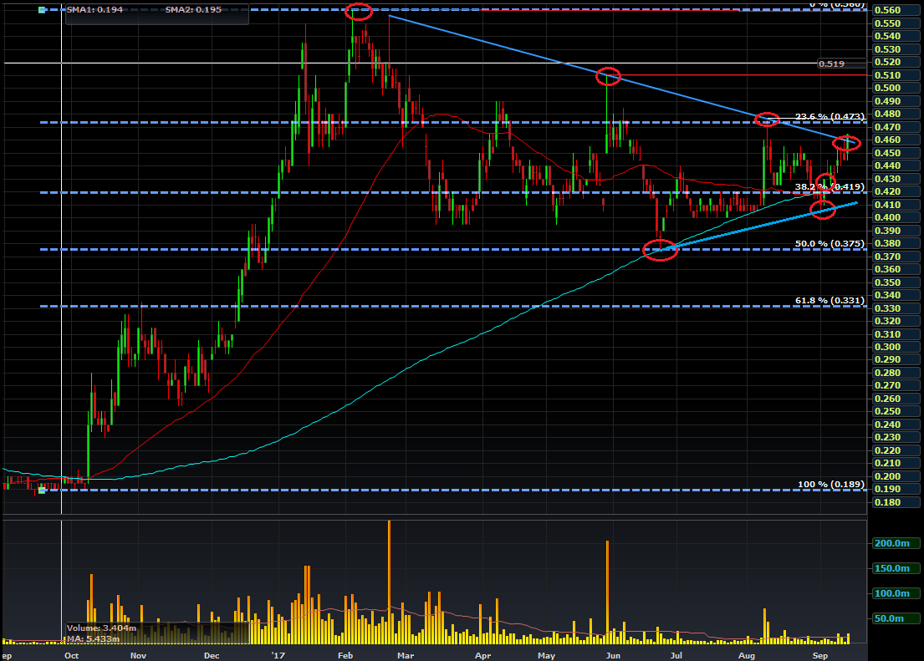
HIBISCS:Is the trendline breakout a signal of a reversal of the 6 months long downtrend?
Lau333
Publish date: Sat, 16 Sep 2017, 08:41 AM
We know that share price never go up or down in straight line. The pertinent question is: How to distinguish reversals from corrections and subsequently making decision to buy, hold or sell?
Characteristic of Correction:
- Preceded by significant market move.
- Independent from fundamental factors.
Characteristic of Reversals:
- Can occur at any moment.
- Often proceeded by important news.
Further reading:
http://www.forexlive.com/

Hibiscus share price closed up by 3.4% at RM0.46 on 15/9/2017. The day high was at RM0.47 which is above the trendline but unfortunately the close at RM0.46 is exactly at the trendline. Strictly from the technical perspective, the treadline breakout required a close ABOVE the trendline to be valid. In a layman terms, the trendline is NOT broken, yet. However, the underlying bullish tone is pretty much obvious in the chart.
- Bullish signal 1: 22/6 - Hold 200 SMA at RM0.375, which is also the 50% Fibonacci Retracement level from RM 0.19 to RM 0.56. This is especially important as the failure to hold this level will flip the bullish case to bearish case.
- Bullish signal 2: 5/9 - Higher low. Bottomed at RM 0.405 vs previous low of RM 0.375.
- Bullish signal 3: 6/9 - Immediate close back above 200SMA & 50SMA after closing below the previous day. Do note that the price lean against 200SMA multiple time but just close below once (5/9) but was immediately rejected the very next day.
- Bullish signal 4: 15/9 – Attempted break above trendline at RM 0.46. From the technical perspective, the trendline breakout required a close above the trendlind to be valid.
I consider the trendline as the line in the sand. Below, the consolidation in the form of a narrowing wedge will continue (as long as it stays within the wedge). Above, this breakout will be a reversal of the nearly 6 month long downtrend/consolidation. Supporting this hypothesis is two important news that will fundamentally alter the stock outlook.
- Brent Crude Oil is now hovering above US$55 with improving demand outlook. The last time Brent Crude is at this price, Hibiscus was trading around RM0.50-RM0.55.
- The purchase of 50% stake in North Sabah EOR is now in the last legs. I will share more on this aspect in my future post.
Above there, the immediate resistance is at RM 0.475 (9/8 High), RM 0.51 (30/5 High) and then a much stronger resistance at 0.56 (6/2 High). Above RM 0.60 is clear blue sky with strong resistance only seen around RM 0.90. Be patient, the breakout is tantalizingly close but not yet!! Those with positions may hold tight and only choose to top up after the breakout is confirmed. Those without may choose to enter only upon breakout with tight stop just under 200 SMA or the lower wedge trendline.
Disclaimer: This is for educational purpose only, and is not a recommendation to buy or sell.
More articles on Hibiscus Petroleum Berhad
Created by Lau333 | Nov 22, 2017
Created by Lau333 | Sep 14, 2017
Discussions
Thank you Connie for the kind comment. I'm humbled. Hibiscus breaks all the resistant points in this write up and rocket all the way up into clear blue sky within one day.
My latest post is up. Do take at look at "Shell Trilogy: The Great Sale".
2017-09-20 22:53


.png)


connie
lau, your analysis is as tantalizing as the consolidation breakout :) patience pays off !! thanks so much for the posting .. hope to read more of your blogs !
2017-09-20 14:23