


Kenanga Research & Investment
Daily Technical Highlights - (RCECAP, LAYHONG)

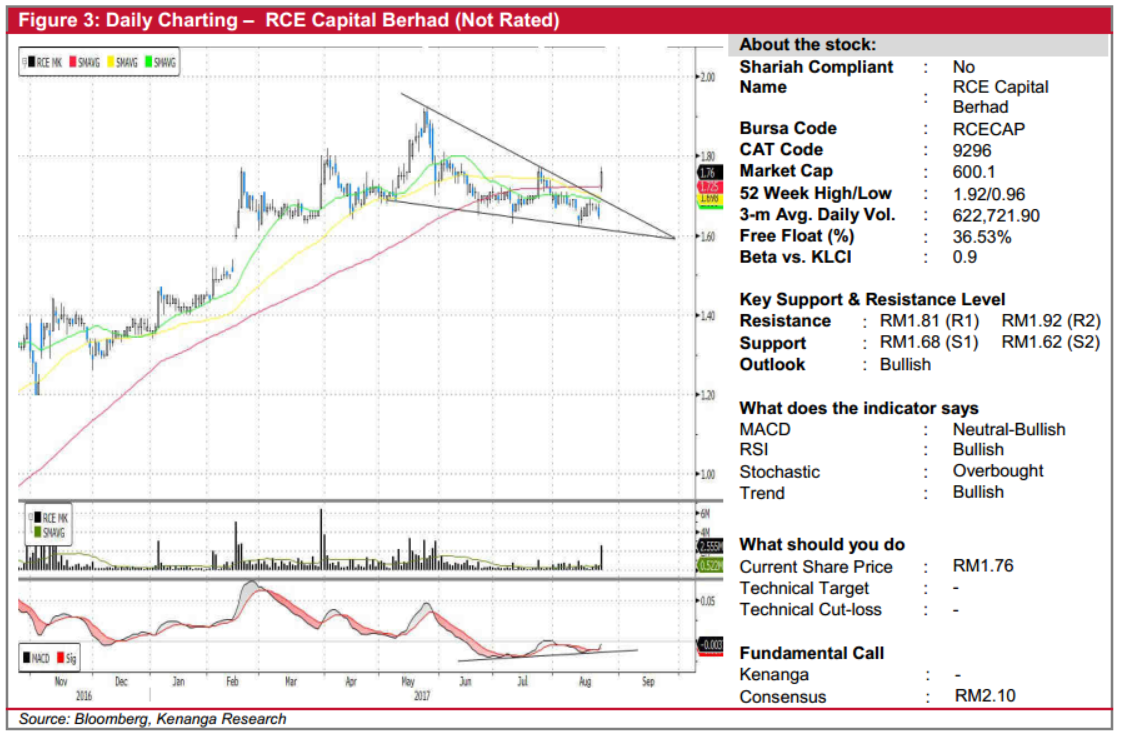
RCECAP (Not Rated). RCECAP’s share price shot up 11.0 sen (6.7%) yesterday to finish at RM1.76 after the company announced its 1Q18 earnings, which grew 19.4% YoY. Not only did the share price break above all-three key SMAs, the bullish move also confirmed a “Falling Wedge” chart pattern in the process. This chart pattern signals a continuation of RCECAP’s prior uptrend, and is further reinforced by the bullish divergent signals on the MACD these recent two months. From here, expect bias to favour the upside towards immediate resistances RM1.81 (R1) and RM1.92 (R2). Any weakness towards the RM1.68 (S1) gap may be viewed as an opportunity to buy-on-dips, although a break below RM1.62 (S2) would be the strong reason to stop loss.
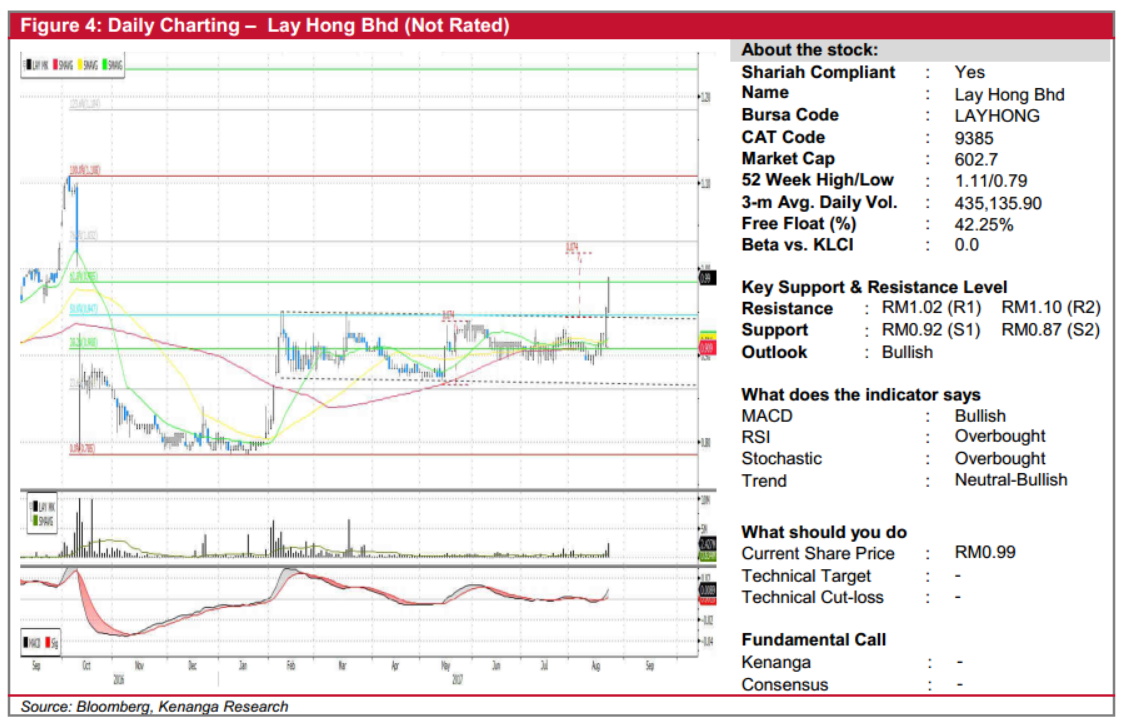
LAYHONG (Not Rated). LAYHONG saw its share price climbed 3.0 sen (3.7%) yesterday to a YTD high of RM0.99 with the share price forming a “white-Marubozu” candlesticks for two consecutive days. Yesterday’s bullish move marked a decisive breakout from the 7-month “Rectangle” continuation pattern which it retested several times previously. The movement was accompanied by increased trading volume by four times with 2.4m shares traded compared to its SMAVG (20) of 0.6m shares. Momentum gain from yesterday’s move was reflected in the MACD line that just crossed above both Signal and zero line marks. Feeling positive about the movement, we expect the share price to trend towards the measurement objective of RM1.02 (R1) and possibly RM1.10 (R2), the all-time high. Downside support located at previous resistance of RM0.92 (S1), although a break below the next support of RM0.87 (S2) would be a huge negative.
Source: Kenanga Research - 24 Aug 2017
Related Stocks
| Chart | Stock Name | Last | Change | Volume |
|---|
More articles on Kenanga Research & Investment
Discussions
Be the first to like this. Showing 0 of 0 comments
Post a Comment
Featured Posts


Latest Videos


Apps


Top Articles
1
2
3
Koon Yew Yin's Blog
4
THE INVESTMENT APPROACH OF CALVIN TAN
5
save malaysia!
7
8
CEO Morning Brief
#
Stock
Score
Daily Stocks
Stock Name
Last
Change
Volume
Stock Name
Last
Change
Volume
Stock Name
Last
Change
Volume
Featured Advertisers / Partners


Ride The Bull Short The Bear
CS Tan
4.9 / 5.0
This book is the result of the author's many years of experience and observation throughout his 26 years in the stockbroking industry. It was written for general public to learn to invest based on facts and not on fantasies or hearsay....