


Kenanga Research & Investment
Daily Technical Highlights – (INARI, DUFU)

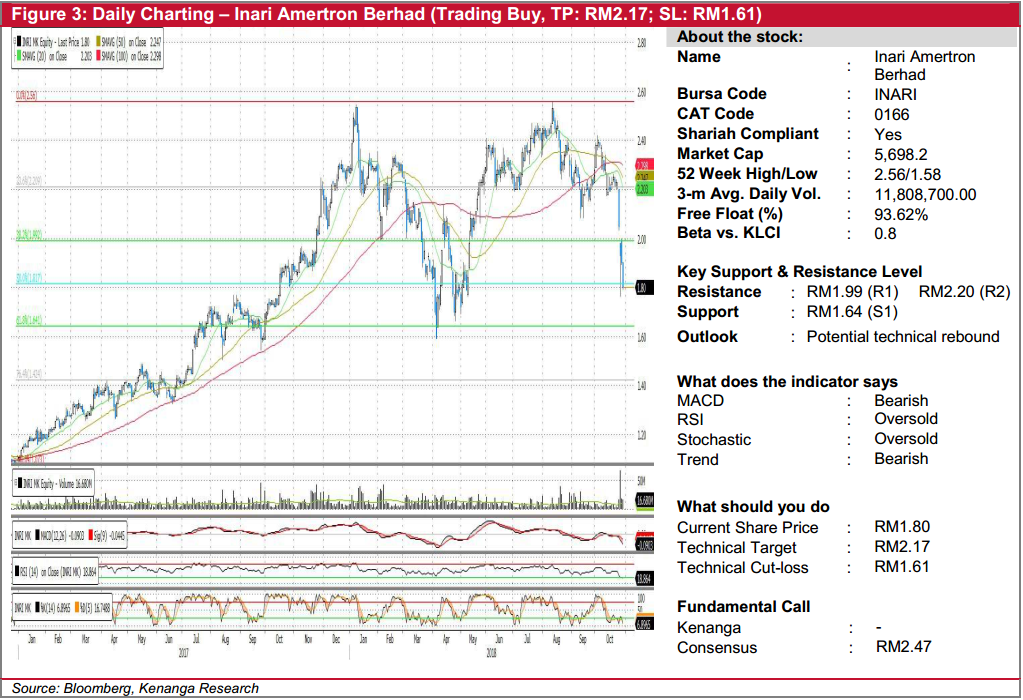
INARI (Trading Buy, TP: RM2.17; SL: RM1.61)
- INARI fell 10.0 sen (-5.26%) to close at RM1.80 yesterday.
- Chart-wise, INARI has experienced a steep sell-down over the past few trading days. However, we believe the sell-down could be overdone due to its sharper-than-expected correction, thus, prompting the possibility of rebound.
- Key momentum indicators such as RSI and stochastic are in oversold conditions and price is hovering around a key Fibonacci retracement level. We also note that oversold conditions on the RSI for INARI seldom occurs, which further strengthens the case of a rebound.
- We look towards RM1.99 (R1) and RM2.20 (R2) as resistances while any further downside bias should see support at RM1.64 (S1) where keen investors may look at to build a position.
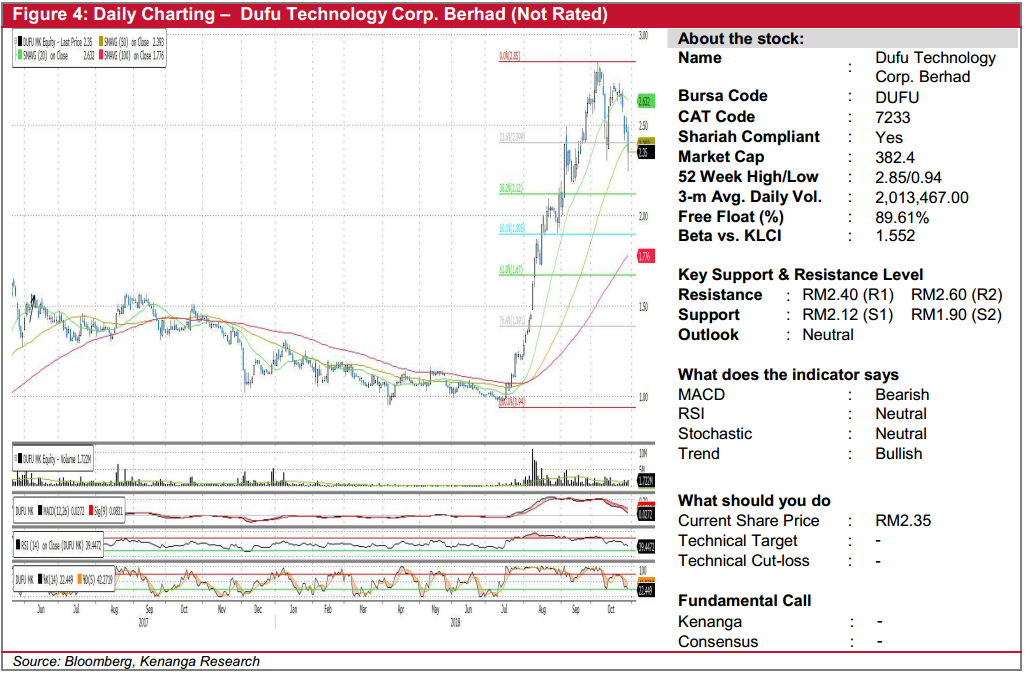
DUFU (Not Rated)
- Yesterday, DUFU declined 11.0 sen (-4.47%) to close at RM2.35.
- Technical-wise, DUFU has enjoyed a remarkable rally since mid-July and is currently experiencing a retracement. We believe the retracement is not over yet given fewer exciting signals from key momentum indicators. We also note the possibility of a head and shoulders pattern in the making giving more hints of further downside.
- From here, immediate support levels can be identified at RM2.12 (S1) and RM1.90 (S2) which are both key Fibonacci levels.
- Conversely, should the buying momentum continue we look at RM2.40 (R1) and RM2.60 (R2), close to its 20-day SMA as resistances.
Source: Kenanga Research - 30 Oct 2018
Related Stocks
| Chart | Stock Name | Last | Change | Volume |
|---|
More articles on Kenanga Research & Investment
Discussions
Be the first to like this. Showing 0 of 0 comments
Post a Comment
Featured Posts
Introducing MY's First IPO Fund for Sophisticated Investors!
New Update. Discover investment communities that resonate with your ideas
M & A Value Partners IPO Equity Fund has been launched - Targeted 13% Return p.a
Latest Videos


Apps


Top Articles
2
3
4
5
THE INVESTMENT APPROACH OF CALVIN TAN
6
save malaysia!
7
Koon Yew Yin's Blog
8
Good Articles to Share
Le Pen makes new threat to withdraw support for French government
#
Stock
Score
Daily Stocks
Stock Name
Last
Change
Volume
Stock Name
Last
Change
Volume
Stock Name
Last
Change
Volume
Featured Advertisers / Partners


Ride The Bull Short The Bear
CS Tan
4.9 / 5.0
This book is the result of the author's many years of experience and observation throughout his 26 years in the stockbroking industry. It was written for general public to learn to invest based on facts and not on fantasies or hearsay....