Daily technical highlights – (AMBANK, MYEG)
kiasutrader
Publish date: Fri, 23 Nov 2018, 09:13 AM
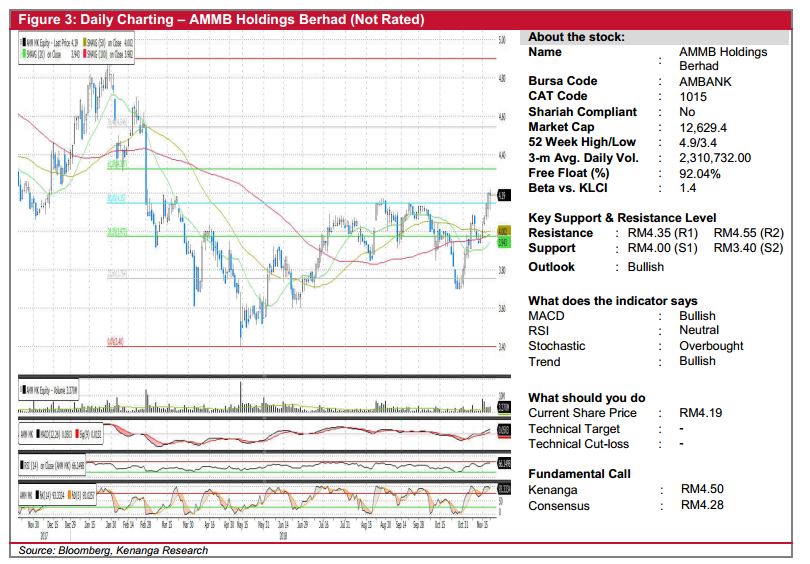
AMBANK (Not Rated)

• Yesterday, AMBANK fell 1.0 sen (-0.24%) to close at RM4.19 on the back of better-than-average trading volume.
• Chart-wise, the share has been on a mini-rally since late-October after recovering from a brief sell-down. Notably, the share broke through a key resistance at RM4.15, which was tested three times this year. This could signify strong buying momentum and possibility of a continuation rally.
• Despite closing lower yesterday, we believed there may be further upside possibility given that its RSI indicator is still trading within a comfortable level and a recent bullish MACD crossover.
• Should the buying momentum continue, expect to find resistances at RM4.35 (R1) and RM4.55 (R2). Conversely, support levels can be identified at RM4.00 (S1) and further down towards RM3.40 (S2).
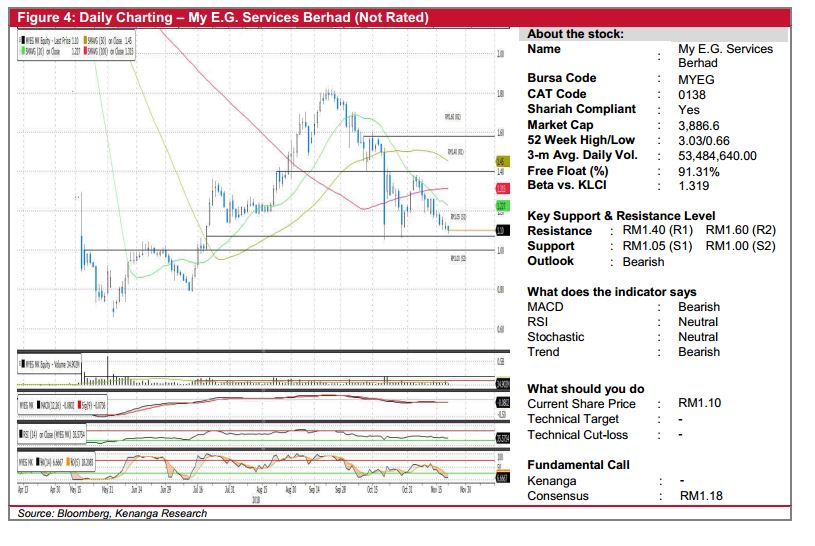
MYEG (Not Rated)

• MYEG dropped 2.0 sen (-1.79%) to close at RM1.10 yesterday.
• Chart-wise, the stock has been on a downtrend after peaking in September. We believed the downtrend may persist given the lack of positive signals from key momentum indicators as well as lower trading volume. The bearish outlook is further backed by an emergence of a “Death-cross” between key SMAs, coupled with sluggish indicators.
• From here, immediate support is identified at RM1.05 (S1) followed by RM1.00 (S2).
• Conversely, resistance level can be found at RM1.40 (R1) and RM1.60 (R2).
Source: Kenanga Research - 23 Nov 2018
Related Stocks
| Chart | Stock Name | Last | Change | Volume |
|---|
Market Buzz
2024-11-26
AMBANK2024-11-26
MYEG2024-11-25
AMBANK2024-11-25
AMBANK2024-11-22
MYEG2024-11-21
AMBANK2024-11-21
AMBANK2024-11-21
MYEG2024-11-21
MYEG2024-11-21
MYEG2024-11-21
MYEG2024-11-21
MYEG2024-11-21
MYEG2024-11-20
AMBANK2024-11-20
AMBANK2024-11-20
AMBANK2024-11-19
AMBANK2024-11-19
AMBANK2024-11-19
AMBANK2024-11-18
AMBANK2024-11-18
AMBANK


