


Kenanga Research & Investment
Daily Technical Highlights – (BURSA, IJM)

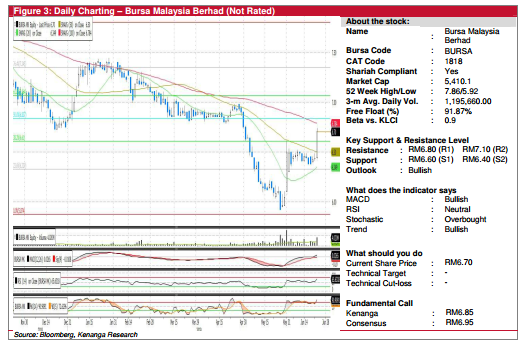
BURSA (Not Rated)
• BURSA gained 27.0 sen (+4.20%) to close at RM6.70.
• Yesterday candlestick formed a long bullish candlestick after a period of consolidation, which could signify that the share has regained buying interest.
• Coupled with the above-average trading volume and uptick in key technical indicators, we believe the share could trend higher to its resistances at RM6.80 (R1) and RM7.10 (R2).
• Conversely, downside support can be identified at RM6.60 (S1) and RM6.40 (S2).
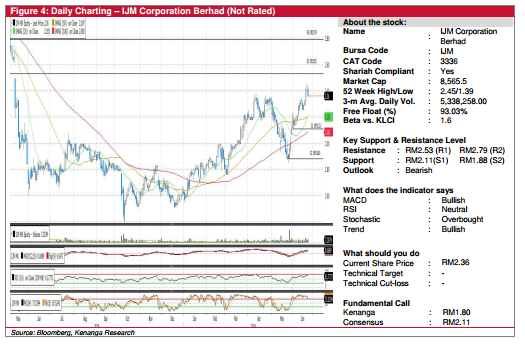
IJM (Not Rated)
• Yesterday, IJM lost 5.0 sen (-2.07%) to end at RM2.36.
• Chart-wise, the share has been on a rally since May’19, which saw it trading above all of its key-SMAs.
• Nevertheless, we observed that key momentum indicators are coming off from their overbought areas, signalling a possible retracement.
• Expect the share to find its next support at RM2.11 (S1) and RM1.88 (S2).
• Conversely, resistance levels can be identified at RM2.53 (R1) and RM2.79 (R2).
Source: Kenanga Research - 25 Jun 2019
Related Stocks
| Chart | Stock Name | Last | Change | Volume |
|---|
Market Buzz
2024-11-26
IJM2024-11-25
IJM2024-11-25
IJM2024-11-25
IJM2024-11-25
IJM2024-11-25
IJM2024-11-22
BURSA2024-11-22
BURSA2024-11-22
IJM2024-11-22
IJM2024-11-22
IJM2024-11-21
BURSA2024-11-21
BURSA2024-11-21
IJM2024-11-21
IJM2024-11-21
IJM2024-11-20
BURSA2024-11-20
IJM2024-11-20
IJM2024-11-19
BURSA2024-11-19
IJM2024-11-18
BURSA2024-11-18
IJM2024-11-18
IJM2024-11-15
IJM2024-11-15
IJMMore articles on Kenanga Research & Investment
Actionable Technical Highlights - PRESS METAL ALUMINIUM HLDG BHD (PMETAL)
Created by kiasutrader | Nov 25, 2024
Actionable Technical Highlights - PETRONAS CHEMICALS GROUP BHD (PCHEM)
Created by kiasutrader | Nov 25, 2024
Weekly Technical Highlights – Dow Jones Industrial Average (DJIA)
Created by kiasutrader | Nov 25, 2024
Malaysia Consumer Price Index - Edge up 1.9% in October amid food price surge
Created by kiasutrader | Nov 25, 2024
Discussions
Be the first to like this. Showing 0 of 0 comments
Post a Comment
Featured Posts


Latest Videos


Apps


Top Articles
1
2
Koon Yew Yin's Blog
3
TA Sector Research
4
Good Articles to Share
Le Pen makes new threat to withdraw support for French government
5
Good Articles to Share
US lawmakers say Hong Kong is becoming hub for financial crime — report
6
Good Articles to Share
7
Good Articles to Share
Global airfares set to rise yet again in 2025, Amex report says
8
M+ Online Research Articles
#
Stock
Score
Daily Stocks
Stock Name
Last
Change
Volume
Stock Name
Last
Change
Volume
Featured Advertisers / Partners


Ride The Bull Short The Bear
CS Tan
4.9 / 5.0
This book is the result of the author's many years of experience and observation throughout his 26 years in the stockbroking industry. It was written for general public to learn to invest based on facts and not on fantasies or hearsay....