


Kenanga Research & Investment
Daily Technical Highlights – (TOPGLOV, GCB)

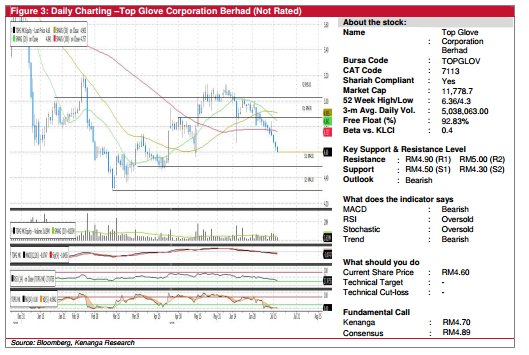
TOPGLOV (Not Rated)
- Yesterday, TOPGLOV declined by 4.0sen (-0.86%) to close at RM4.60.
- The stock has been on a downtrend since the formation of a “Double Top” in mid-May.
- Yesterday candlestick formed a third black candlestick, which indicates the strong selling pressure. Given the weakness displayed in both its RSI and Stochastic indicator, we believe the stock could trend lower.
- With that, we see downside support at RM4.50 (S1) and RM4.30 (S2).
- Conversely, overhead resistance can be seen at RM4.90 (R1) and RM5.00 (R2).
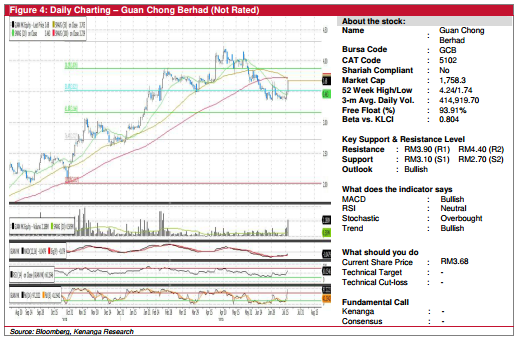
GCB (Not Rated)
- GCB closed higher by 18.0 sen (+5.14%) to end at RM3.68.
- The chart has been consolidating since mid-June.
- Yesterday candlestick formed a “Marubozu” candlestick and closed above the stock’s 20-Day SMA. Coupled with above average trading volume and uptick in key technical indicators, we expect further upside to be seen.
- Should buying momentum persist, overhead resistances can be seen at RM3.90 (R1) and RM4.40 (R2).
- Conversely, key support level can be seen at RM3.10 (S1) and RM2.70 (S2).
Source: Kenanga Research - 18 Jul 2019
Related Stocks
| Chart | Stock Name | Last | Change | Volume |
|---|
More articles on Kenanga Research & Investment
Actionable Technical Highlights - PRESS METAL ALUMINIUM HLDG BHD (PMETAL)
Created by kiasutrader | Nov 25, 2024
Actionable Technical Highlights - PETRONAS CHEMICALS GROUP BHD (PCHEM)
Created by kiasutrader | Nov 25, 2024
Weekly Technical Highlights – Dow Jones Industrial Average (DJIA)
Created by kiasutrader | Nov 25, 2024
Malaysia Consumer Price Index - Edge up 1.9% in October amid food price surge
Created by kiasutrader | Nov 25, 2024
Discussions
Be the first to like this. Showing 0 of 0 comments
Post a Comment
Featured Posts


Latest Videos


Apps


Top Articles
1
2
Koon Yew Yin's Blog
3
TA Sector Research
4
Good Articles to Share
Le Pen makes new threat to withdraw support for French government
5
Good Articles to Share
US lawmakers say Hong Kong is becoming hub for financial crime — report
6
Good Articles to Share
7
Good Articles to Share
Global airfares set to rise yet again in 2025, Amex report says
8
M+ Online Research Articles
#
Stock
Score
Daily Stocks
Stock Name
Last
Change
Volume
Stock Name
Last
Change
Volume
Featured Advertisers / Partners


Ride The Bull Short The Bear
CS Tan
4.9 / 5.0
This book is the result of the author's many years of experience and observation throughout his 26 years in the stockbroking industry. It was written for general public to learn to invest based on facts and not on fantasies or hearsay....