


Kenanga Research & Investment
Daily technical highlights – (MMSV, TECFAST) Daily Charting – MMSV

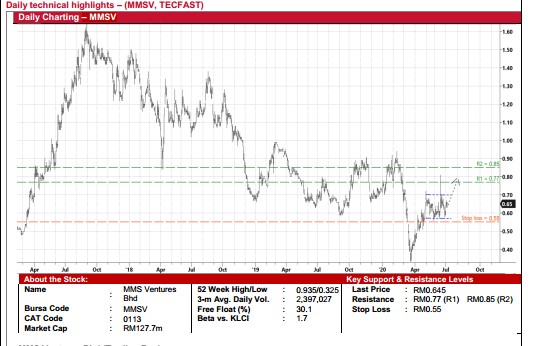
MMS Ventures Bhd (Trading Buy)
- MMSV is a beneficiary of the fast-growing technology industry. The Group is involved in the manufacturing of high-tech automation system (such as inspection and testing machines) and has a customer base operating in the LED (for applications in smart phones and automotive), semiconductor and OEM/ODM segments.
- Its share price has recovered from a low of RM0.33 on 19 March this year to hit a recent high of RM0.81. Since then, the stock has been moving sideways within a narrow trading range, closing at RM0.645 yesterday.
- On the chart, the stock could break out from its existing consolidation pattern, which would then propel the share price to test our resistance thresholds of RM0.77 (R1) and RM0.85 (R2). This translates to potential upsides of 19% and 32%, respectively.
- Our stop loss level is set at RM0.55 (representing a downside risk of 15%).
- Meanwhile, the Group was profitable in the recently released 1QFY20 result with reported earnings of RM0.4m (versus 1QFY19’s RM1.7m). Its balance sheet strength remains strong with net cash & quoted investments of RM30.4m (or 14.9 sen per share) as of end-Mar 2020.
- In addition, MMSV – which has been paying out annual dividends of at least 2 sen per share in the last five years – offers a decent dividend yield of 3.1%, assuming the Company maintains its DPS of 2 sen this year
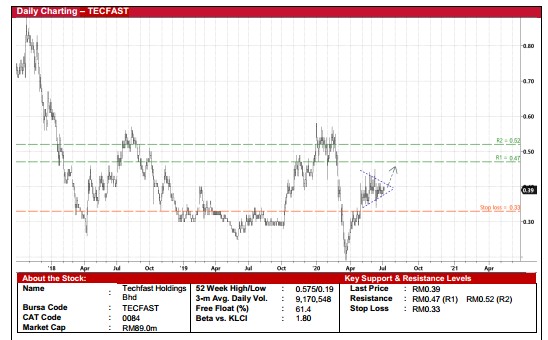
Techfast Holdings Bhd (Trading Buy)
- TECFAST is poised to ride on the rising global semiconductor sales. As a manufacturer of self-clinching fasteners, electronic hardware and precision turned parts, mould cleaning rubber sheets and LED epoxy encapsulant materials, TECFAST derives its income from customers who are operating in the Outsourced Semiconductor Test and Assembly (OSAT) space.
- After rebounding from a trough of RM0.19 on 19 March to a recent high of RM0.45, the stock (which closed at RM0.39 yesterday) has been oscillating in a sideways trading pattern.
- Technically speaking, TECFAST’s share price may be on the verge of breaking out from a transitional triangle formation. This continuation pattern typically indicates that the prevailing sideways price action is just a pause and the next move would likely be in the same direction as the preceding trend.
- If so, a likely breakout from the triangle pattern would then lift the stock to challenge our resistance lines of RM0.47 (R1) and RM0.52 (R2), representing potential upsides of 21% and 33%, respectively.
- We have set our stop loss level at RM0.33 (or 15% downside risk).
- Fundamentally, the Group made a net profit of RM0.7m in 1QFY20 (a slight improvement from 1QFY19’s RM0.5m) while net cash stood at RM11.2m (or 4.9 sen per share) as of end-March 2020
Source: Kenanga Research - 7 Jul 2020
Related Stocks
| Chart | Stock Name | Last | Change | Volume |
|---|
More articles on Kenanga Research & Investment
Weekly Technical Highlights – Dow Jones Industrial Average (DJIA)
Created by kiasutrader | Aug 26, 2024
Discussions
Be the first to like this. Showing 0 of 0 comments
Post a Comment
Featured Posts
Introducing MY's First IPO Fund for Sophisticated Investors!
New Update. Discover investment communities that resonate with your ideas
M & A Value Partners IPO Equity Fund has been launched - Targeted 13% Return p.a
Latest Videos

.png)


Apps


Top Articles
1
Koon Yew Yin's Blog
3
Koon Yew Yin's Blog
4
Stock Market Enthusiast
PBBANK: Technical Outlook Suggest Target of RM5 (Uptrend but Overbought) - KingKKK
5
6
Koon Yew Yin's Blog
7
8
#
Stock
Score
Daily Stocks
Stock Name
Last
Change
Volume
Stock Name
Last
Change
Volume
Stock Name
Last
Change
Volume
Featured Advertisers / Partners


Ride The Bull Short The Bear
CS Tan
4.9 / 5.0
This book is the result of the author's many years of experience and observation throughout his 26 years in the stockbroking industry. It was written for general public to learn to invest based on facts and not on fantasies or hearsay....