


Kenanga Research & Investment
Daily technical highlights – (MFLOUR, ASTRO)

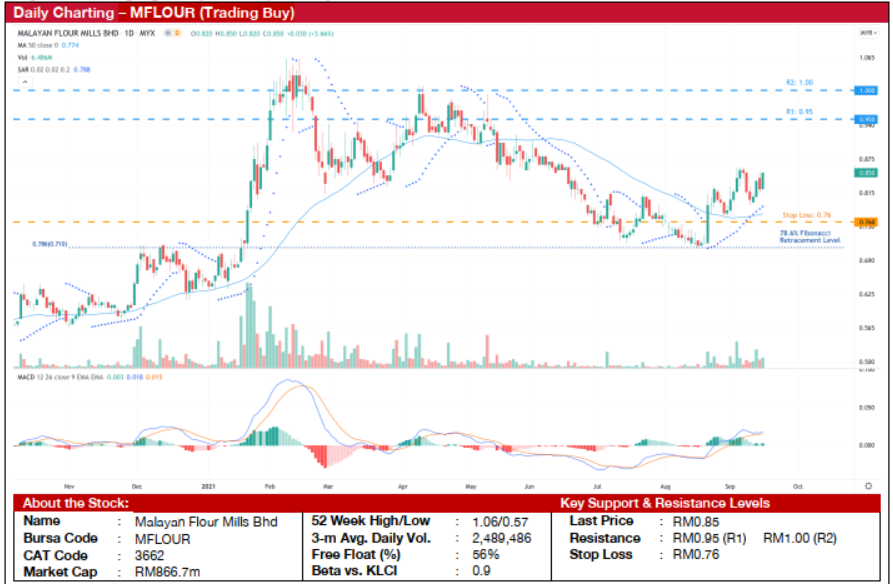
Malayan Flour Mills Bhd (Trading Buy)
• From a peak of RM1.06 in February this year, MFLOUR’s share price has corrected 33% to bottom out at a low of RM0.71 in August. After finding support at the 78.6% Fibonacci retracement level of RM0.71, the stock has staged a subsequent rebound with numerous technical signs currently suggesting that it is in the midst of an uptrend.
• Firstly, the trend of lower highs and lower lows since February has ended after it found support at the aforesaid Fibonacci retracement level. The stock has formed a large bullish candlestick in September and plotted higher highs and higher lows since then.
• Secondly, the aforementioned bullish candlestick has crossed above the 50-day SMA before bouncing off from a subsequent test of the 50-day SMA.
• Thirdly, the emergence of higher highs and higher lows has been accompanied by rising trading volumes, indicating large buying interest.
• Lastly, both the Parabolic SAR and MACD indicators suggest that the uptrend is currently gaining momentum.
• On its way up, we believe the share price could potentially challenge our resistance levels of RM0.95 (R1; 12% upside potential) and RM1.00 (R2; 18% upside potential).
• We have pegged our stop loss at RM0.76 (or an 11% downside risk).
• Fundamentally, MFLOUR is involved in the flour & grains trading and poultry integration businesses.
• In FY20, it earned a weaker net profit of RM5m (-87% YoY) likely due to higher raw material costs. However, on the back of a strong rebound in 1HFY21 with net profit coming in at RM60m (+60% YoY), consensus is expecting MFLOUR to achieve a net profit of RM80m (approx. 14-fold YoY) in FY21 and RM106m (+33% YoY) in FY22.
• These translate to forward PERs of 10.9x and 8.2x, respectively which are below its 5-year average of 35x.
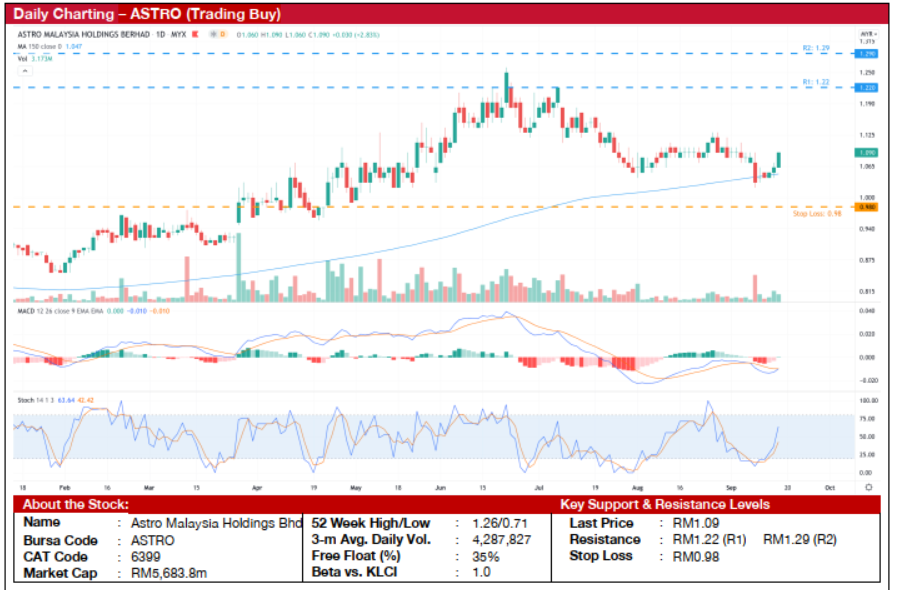
Astro Malaysia Holdings Berhad (Trading Buy)
• Since October 2020, ASTRO’s share price has been on an uptrend with the formation of higher highs and higher lows along the way, which is further supported by the December 2020 crossing above the 150-day SMA.
• However, after failing to break above the RM1.22 resistance level in June and July this year, the stock has corrected 19% to hit a lower low of RM1.02. Nevertheless, when the stock tested and failed to break below the 150-day SMA six trading days ago, the staging of an immediate rebound suggests that the long-term uptrend is still intact.
• The large bearish candlestick was accompanied by relatively high volume, possibly indicating that the weak longs have exited their positions, thus laying the grounds for an ensuing rally.
• The MACD indicator is also showing signs of waning downward momentum with nascent signs of a reversal in sight.
• With the stochastic indicator also showing strengthening momentum, an anticipated upward movement could lift the share price to challenge our resistance levels of RM1.22 (R1; 12% upside potential) and RM1.29 (R2; 18% upside potential).
• We have pegged our stop loss at RM0.98 (or 10% downside risk), offering a risk-reward ratio of 1.18x.
• ASTRO is in the business of providing a variety of entertainment contents across its TV, radio, digital and e-commerce platforms.
• In FYE Jan 2021, ASTRO achieved a net profit of RM540m (-18% YoY). Following the posting of a core net profit of RM147m (+37.4% YoY) in the three-month period ended April 2021, ASTRO is poised to achieve a net profit of RM554m in FYE Jan 22 and RM576m in FYE Jan 23, according to consensus estimates.
• These translate to forward PERs of 10.3x and 9.9x, respectively compared to its 5-year historical average of 15.3x.
Source: Kenanga Research - 17 Sept 2021
Related Stocks
| Chart | Stock Name | Last | Change | Volume |
|---|
More articles on Kenanga Research & Investment
Bond Weekly Outlook - MGS/GII likely to rise amid ongoing US economic resilience
Created by kiasutrader | Nov 22, 2024
Discussions
Be the first to like this. Showing 0 of 0 comments
Post a Comment
Featured Posts
Introducing MY's First IPO Fund for Sophisticated Investors!
New Update. Discover investment communities that resonate with your ideas
M & A Value Partners IPO Equity Fund has been launched - Targeted 13% Return p.a
Latest Videos


Apps


Top Articles
1
2
4
save malaysia!
Visa-free travel to China extended for Malaysians to 30 days
5
6
7
BFM Podcast
8
#
Stock
Score
Daily Stocks
Stock Name
Last
Change
Volume
Stock Name
Last
Change
Volume
Stock Name
Last
Change
Volume
Featured Advertisers / Partners


Ride The Bull Short The Bear
CS Tan
4.9 / 5.0
This book is the result of the author's many years of experience and observation throughout his 26 years in the stockbroking industry. It was written for general public to learn to invest based on facts and not on fantasies or hearsay....