


Kenanga Research & Investment
Daily technical highlights – (TGUAN, TAFI)

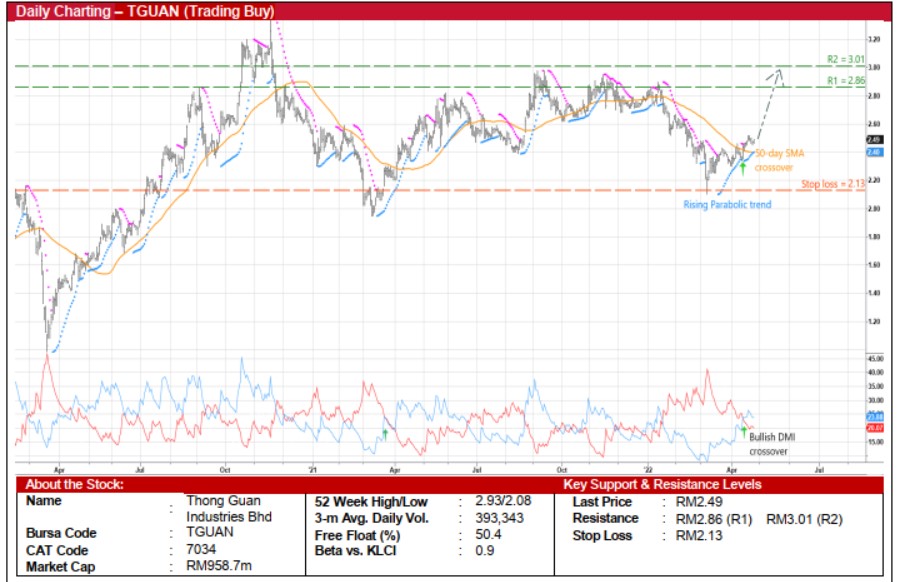
Thong Guan Industries Bhd (Trading Buy)
• Following a retracement from a high of RM2.87 in mid-January this year, a recent rebound from a trough of RM2.08 in early March has paved the way for TGUAN’s share price to stage an uptrend reversal ahead.
• Backed by the bullish technical signals arising from: (i) the DMI Plus crossing over the DMI Minus, (ii) the Parabolic SAR plotting an upward trajectory, and (iii) the price cutting above the 50–day SMA, the shares will likely advance further.
• With that, the stock could climb towards our resistance thresholds of RM2.86 (R1; 15% upside potential) and RM3.01 (R2; 21% upside potential).
• We have placed our stop loss price level at RM2.13 (or a 14% downside risk from yesterday’s close of RM2.49).
• In the business of manufacturing: (i) plastic packaging products, and (ii) food, beverages and other consumable products, TGUAN announced net profit of RM23.3m (+35% YoY) in 4QFY21, taking full-year FY21’s bottomline to RM93.0m (+23% YoY).
• Going forward, consensus is projecting the group to make higher net earnings of RM113.5m for FY December 2022 and RM147.0m for FY December 2023. This translates to forward PERs of 8.4x this year and 6.5x next year, respectively.
• Meanwhile, TGUAN’s earnings outlook could get a lift from the stronger USD against the RM (up 4.3% since early March this year to RM4.36 per USD currently) as the group receives the bulk of its sales proceed in USD (which would more than offset the higher imported resin cost).
• Another key investment merit for TGUAN is its balance sheet strength, which is supported by net cash holdings of RM111.7m (translating to 29 sen per share) as of end-December last year.
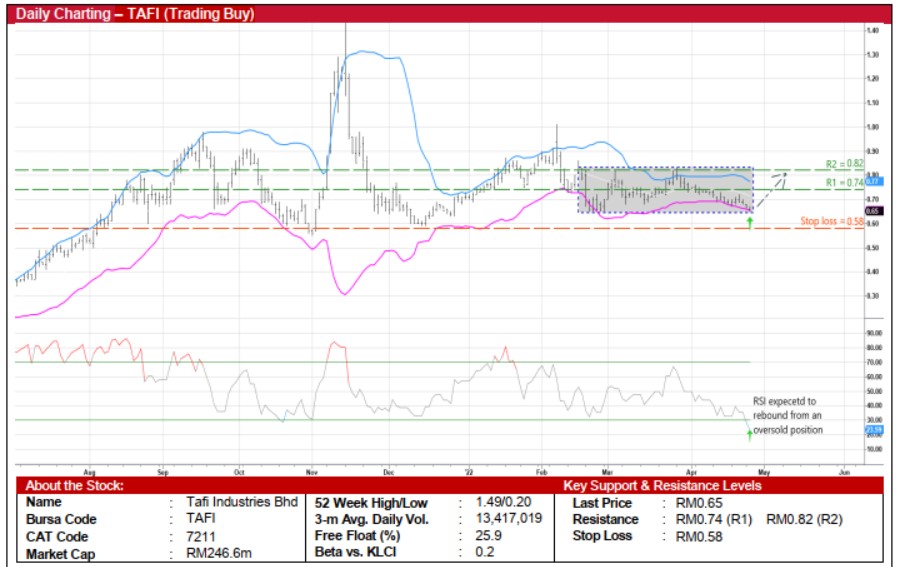
Tafi Industries Bhd (Trading Buy)
• An upward shift in TAFI shares may be on the horizon amid a sideways range since mid-February this year.
• With the share price presently hovering at: (i) the lower Bollinger Band, and (ii) the bottom of a rectangle pattern, a technical rebound is anticipated which is further reinforced by the RSI indicator’s reversal from an oversold territory.
• This could then set the stage for the stock to make its way towards our resistance levels of RM0.74 (R1; 14% upside potential) and RM0.82 (R2; 26% upside potential).
• Our stop loss price line is pegged at RM0.58 (or an 11% downside risk).
• Business-wise, TAFI is principally involved in the manufacturing of home and office furniture. In early 2021, the group has diversified into property development and construction activities.
• After posting a turnaround in net earnings to RM3.2m in 4QFY21 (from net loss of RM5.3m previously), TAFI reported full year net profit of RM5.5m in FY December 2021 (versus FY20’s net loss of RM9.4m). Of which, the manufacturing division accounted for 96% of last year’s overall earnings.
• The group’s balance sheet is financially steady with net cash position of RM3.4m (or 0.9 sen per share) as of end-December 2021.
• With a manufacturing business that is mainly driven by export sales, TAFI stands to benefit from the prevailing strength in the USD against the RM (up 4.3% since early March this year to RM4.36 per USD currently). Coupled with the resumption of global economic activities post the Covid-19 pandemic, the group’s sequential quarterly earnings will likely gather pace going forward.
Source: Kenanga Research - 27 Apr 2022
Related Stocks
| Chart | Stock Name | Last | Change | Volume |
|---|
More articles on Kenanga Research & Investment
Bond Weekly Outlook - MGS/GII likely to rise amid ongoing US economic resilience
Created by kiasutrader | Nov 22, 2024
Discussions
Be the first to like this. Showing 0 of 0 comments
Post a Comment
Featured Posts


Latest Videos


Apps


Top Articles
1
2
Koon Yew Yin's Blog
CPO price is rising rapidly as shown by chart below - Koon Yew Yin
3
5
save malaysia!
Visa-free travel to China extended for Malaysians to 30 days
6
7
8
BFM Podcast
#
Stock
Score
Daily Stocks
Stock Name
Last
Change
Volume
Stock Name
Last
Change
Volume
Stock Name
Last
Change
Volume
Featured Advertisers / Partners


Ride The Bull Short The Bear
CS Tan
4.9 / 5.0
This book is the result of the author's many years of experience and observation throughout his 26 years in the stockbroking industry. It was written for general public to learn to invest based on facts and not on fantasies or hearsay....