Daily technical highlights – (SIGN, SLVEST)
kiasutrader
Publish date: Thu, 11 Aug 2022, 09:05 AM

Signature International Bhd (Trading Buy)
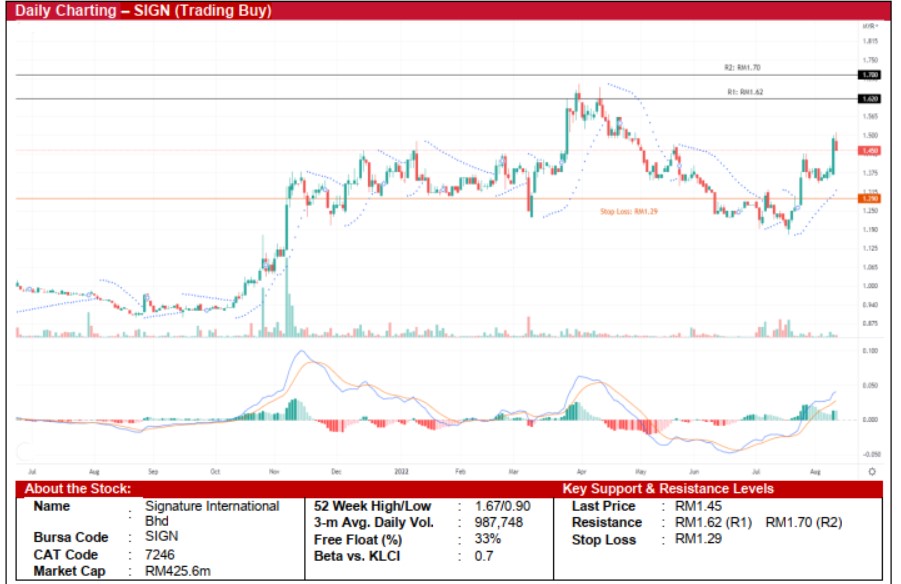
• Following a retracement from a high of RM1.67 in March 2022, a recent rebound from a trough of RM1.17 has paved the way for SIGN’s share price to plot an uptrend reversal.
• On the chart, the appearance of long candlesticks is indicating the resumption of buying interest in the shares, with the upward momentum likely to continue based on the rising Parabolic SAR trend and strengthening MACD signal backed by a strong histogram pattern.
• Therefore, the stock could rise to challenge our resistance levels of RM1.62 (R1; 12% upside potential) and RM1.70 (R2; 17% upside potential).
• We have pegged our stop loss at RM1.29, representing a downside risk of 11%.
• SIGN is involved in the designing and distribution of kitchen and wardrobe systems business.
• Fundamental-wise, the group reported net profit of RM3.6m (-18% QoQ) in 3QFY22, which brought 9MFY22 net profit to RM9.9m (+39% YoY).
• Based on consensus estimates, the group is expected to report net profit of RM20.2m in FY June 2022 and RM18.8m in FY June 2023, translating to forward PERs of 21.0x and 22.6x, respectively.

Solarvest Holdings Bhd (Trading Buy)
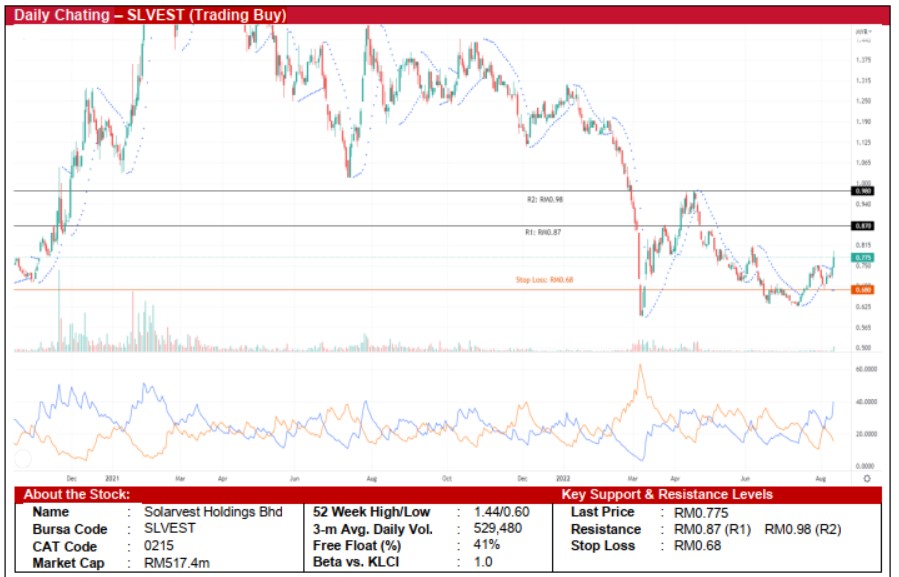
• SLVEST’s share price recently slid to a low of RM0.63 in July 2022 before staging a rebound to signal a probable uptrend reversal.
• Backed by the rising Parabolic SAR trend and the DMI Plus crossover above the DMI Minus, the stock is expected to move higher ahead.
• Hence, the stock could rise to challenge our resistance levels of RM0.87 (R1; 12% upside potential) and RM0.98 (R2; 26% upside potential).
• We have pegged our stop loss at RM0.68, representing a downside risk of 12%.
• Business-wise, SLVEST operates as a solar system installer and service provider.
• Earnings-wise, the group reported net profit of RM3.7m (+85% QoQ) in 4QFY22, which took full-year FY22 bottomline to RM6.9m (-57% YoY).
• Going forward, consensus is forecasting SLVEST to report net profit of RM21.1m in FY March 2023 and RM28.3m in FY March 2024, which translate to forward PERs of 24.2x and 19.4x, respectively.
Source: Kenanga Research - 11 Aug 2022
Related Stocks
| Chart | Stock Name | Last | Change | Volume |
|---|
More articles on Kenanga Research & Investment
Created by kiasutrader | Nov 22, 2024


