


Kenanga Research & Investment
Weekly Technical Highlights – Dow Jones Industrial Average (DJIA)

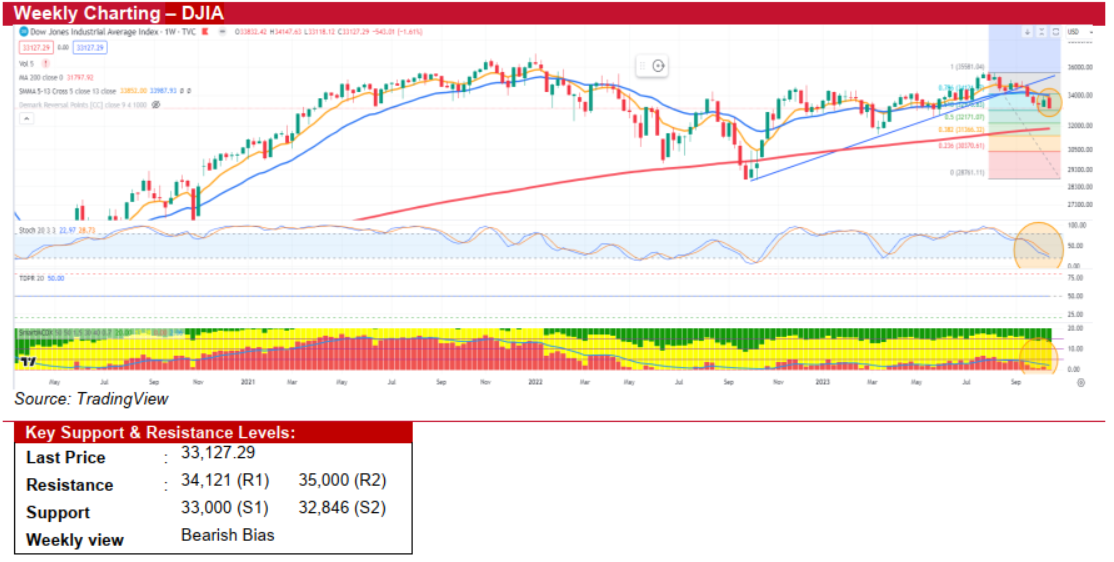
Dow Jones Industrial Average (DJIA) (Bearish Bias)
- Last week, the DJIA fell by 543 points or 1.61%, closing at 33,127.29, as investor’s worries and rising yields offset strong earnings. Mixed messages from Fed Chair Powell further contributed to market volatility. Notably, 73% of S&P 500 companies that have reported thus far have exceeded earnings expectations, as per FactSet data.
- The cautious market mood is likely to continue this week. Key earnings reports from Microsoft, Alphabet, Meta Platforms, and Amazon, along with upcoming U.S. economic indicators like 3Q GDP and the core PCE price index, are set to offer further insights into market dynamics. Volatility in oil prices is expected to persist amid geopolitical tensions. Additionally, the European Central Bank's policy meeting on Thursday is anticipated to leave interest rates unchanged.
- From a technical perspective, The DJIA's daily chart has exhibited three consecutive long red candles, commonly known as "Three Black Crows," signalling the potential onset of a bearish trend. The weekly chart echoes this sentiment, displaying a bearish engulfing pattern, which typically indicates an impending market downturn. Furthermore, the breach of the 200-day SMA adds to the prevailing bearish market sentiment.
- We maintain a bearish outlook on the DJIA for the upcoming week. The index is poised to retest immediate support levels at 33,000 and its recent low at 32,846. If these levels are breached, the next critical support is at 32,171, aligning with the 50% Fibonacci retracement. Conversely, strong earnings from mega-cap firms or favorable economic data could push the index towards resistance levels at 34,121 and the psychological barrier of 35,000.
Source: Kenanga Research - 23 Oct 2023
More articles on Kenanga Research & Investment
Bond Weekly Outlook - MGS/GII likely to rise amid ongoing US economic resilience
Created by kiasutrader | Nov 22, 2024
Discussions
Be the first to like this. Showing 0 of 0 comments
Post a Comment
Featured Posts


Latest Videos


Apps


Top Articles
1
Axcapital's investment blog
KAB - Executing its way to a record quarter. Could more Petronas contracts be coming?
2
Koon Yew Yin's Blog
3
BFM Podcast
4
BFM Podcast
5
7
BFM Podcast
8
BFM Podcast
#
Stock
Score
Daily Stocks
Stock Name
Last
Change
Volume
Stock Name
Last
Change
Volume
Stock Name
Last
Change
Volume
MQ Trading Signals
Stock
Time
Signal
Duration
Stock
Time
Signal
Duration
Featured Advertisers / Partners


Ride The Bull Short The Bear
CS Tan
4.9 / 5.0
This book is the result of the author's many years of experience and observation throughout his 26 years in the stockbroking industry. It was written for general public to learn to invest based on facts and not on fantasies or hearsay....