Actionable Technical Highlights – (MSM MALAYSIA HOLDINGS BHD)
kiasutrader
Publish date: Wed, 25 Oct 2023, 10:15 AM
MSM MSIA HOLDINGS BERHAD (Technical Buy)
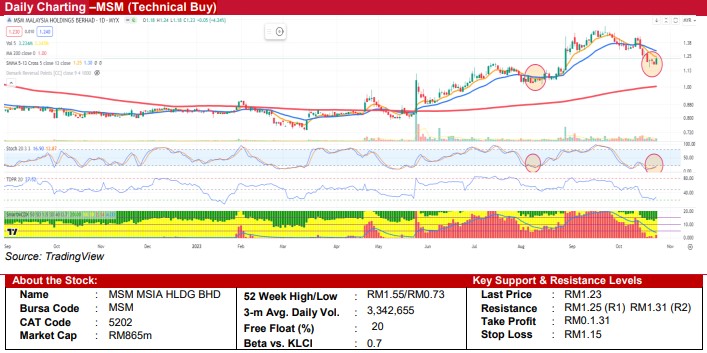
• MSM has undergone a 20% retracement from its recent high of RM1.43, reaching as low as RM1.15. It has since consolidated in a narrow range. Yesterday's closing price of RM1.23 (+4%) formed a “Bullish Engulfing” chart pattern, indicating a potential technical rebound after its recent sharp decline.
• In terms of technical analysis, key indicators like the Stochastic Oscillator and the Tom Demark Pressure Ratio (TDRP) are displaying early signs of exiting the oversold zone, suggesting a bullish outlook ahead.
• A sustained break above the immediate resistance at RM1.25 (the 5-day Simple Moving Average [SMA]) could trigger a rally towards RM1.31 (the 13-day SMA). Conversely, a drop below the support level of RM1.15 may initiate a new downtrend.
• Our recommendation is to consider a trading position at RM1.23, with a take-profit target of RM1.31, offering a potential upside of approximately 6.5%. To manage risks, we advise implementing a stop-loss at RM1.15, resulting in a 1-to-1 risk-to-reward ratio, with a potential downside of approximately 6.5%
Source: Kenanga Research - 25 Oct 2023
Related Stocks
| Chart | Stock Name | Last | Change | Volume |
|---|
More articles on Kenanga Research & Investment
Created by kiasutrader | Nov 22, 2024


