


Kenanga Research & Investment
Actionable Technical Highlights – (KSL HOLDINGS BHD)

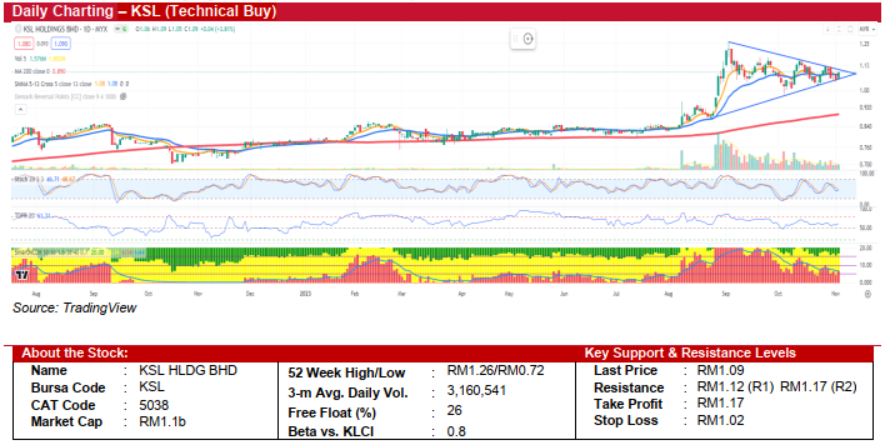
KSL HOLDINGS BERHAD (Technical Buy)
- KSL closed 3.8% higher at RM1.09 yesterday, forming a symmetrical triangle chart pattern. As the price progresses towards the apex of the triangle, it is poised to either breach the upper trend line, indicating a breakout, or breach the lower trend line, leading to a breakdown. The convergence of both short-term and long-term (5 and 13-day) Simple Moving Averages (SMA) further points to an impending decisive movement.
- However, we believe that the probability of breaching the upper trend line is elevated, given the positive momentum observed under the MCDX's banker chip. Additionally, the ascending trajectories of both the Stochastic Oscillator and the Tom Demark Pressure Ratio (TDRP) suggest that there could be a resurgent in buying interest on the horizon.
- A clear break above the critical resistance level of RM1.12 could prompt the stock to challenge the next substantial resistance levels at RM1.17. On the other hand, a significant decline below the key support level of RM1.02 may initiate a downward trend.
- We suggest contemplating an entry into the stock at RM1.09 or close to its 13-day SMA, targeting a take-profit level at RM1.17, which presents a potential upside of approximately 7.3%. To mitigate risk, we recommend setting a stop-loss at RM1.02, corresponding to a potential downside of roughly 6.4%.
Source: Kenanga Research - 3 Nov 2023
Related Stocks
| Chart | Stock Name | Last | Change | Volume |
|---|
Market Buzz
More articles on Kenanga Research & Investment
Bond Weekly Outlook - MGS/GII likely to rise amid ongoing US economic resilience
Created by kiasutrader | Nov 22, 2024
Discussions
Be the first to like this. Showing 0 of 0 comments
Post a Comment
Featured Posts
Introducing MY's First IPO Fund for Sophisticated Investors!
New Update. Discover investment communities that resonate with your ideas
M & A Value Partners IPO Equity Fund has been launched - Targeted 13% Return p.a
Latest Videos


MQ Trading Signals
Time
Signal
Duration
Type
2024-11-22 16:00:00
EMA 5
5 Mins
SELL
2024-11-22 16:00:00
ADX
5 Mins
BUY
2024-11-22 15:55:00
ADX
5 Mins
SELL
2024-11-22 15:50:00
EMA 5
5 Mins
BUY
2024-11-22 15:45:00
ADX
5 Mins
BUY
Apps


Top Articles
1
Axcapital's investment blog
KAB - Executing its way to a record quarter. Could more Petronas contracts be coming?
2
Koon Yew Yin's Blog
3
BFM Podcast
4
BFM Podcast
5
7
BFM Podcast
8
BFM Podcast
#
Stock
Score
Daily Stocks
Stock Name
Last
Change
Volume
Stock Name
Last
Change
Volume
Stock Name
Last
Change
Volume
Featured Advertisers / Partners


Ride The Bull Short The Bear
CS Tan
4.9 / 5.0
This book is the result of the author's many years of experience and observation throughout his 26 years in the stockbroking industry. It was written for general public to learn to invest based on facts and not on fantasies or hearsay....