


Kenanga Research & Investment
Weekly Technical Highlights – Dow Jones Industrial Average (DJIA)

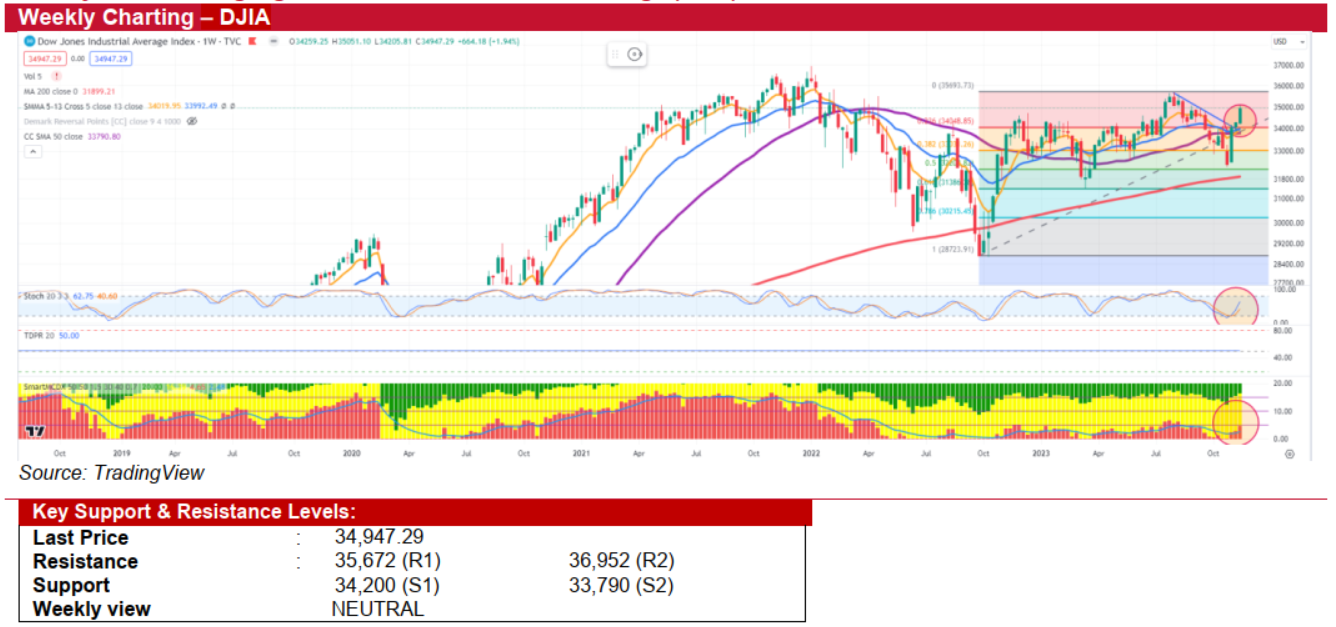
Dow Jones Industrial Average (DJIA) (NEUTRAL)
- Lately, there's been a renewed optimism among investors in the stock market, reversing a downtrend that lasted from August through much of October. This upswing is partly due to a decline in Treasury yields, sparked by expectations that the Federal Reserve may stop raising interest rates. Last week, the S&P 500, Nasdaq, and Dow all secured their third week of consecutive gains, the most extended streak since July for the S&P and Dow, and since June for the Nasdaq.
- In the upcoming shortened trading week, investors will focus on the Federal Reserve's recent meeting minutes for new clues about future interest rate trends. Retailers are gearing up for a potentially robust holiday shopping season while Nvidia, as the final mega cap firm, is set to announce its earnings on Tuesday.
- From a technical viewpoint, the DJIA's weekly Stochastic Oscillator shows an upward trend after rebounding from oversold conditions, and its 5-week SMA has surpassed the 13-week SMA, maintaining a bullish outlook. However, the daily chart is revealing early signs of exhaustion, with the index trading sideways for the past three days and forming a 'Doji' pattern, indicating market indecision. Additionally, the daily overbought Stochastic Oscillator suggests a potential short-term pullback.
- We expect the index to undergo consolidation with some downside tendencies this week. Key resistance levels to monitor are 35,672, followed by 36,952. On the downside, immediate support are 34,200 and 33,790, the latter aligning with its 50-week SMA and near the 38.2% Fibonacci retracement level, indicating this level could offer solid support in case of a pullback.
Source: Kenanga Research - 20 Nov 2023
More articles on Kenanga Research & Investment
Bond Weekly Outlook - MGS/GII likely to rise amid ongoing US economic resilience
Created by kiasutrader | Nov 22, 2024
Discussions
Be the first to like this. Showing 0 of 0 comments
Post a Comment
Featured Posts


Latest Videos


Apps


Top Articles
1
Axcapital's investment blog
KAB - Executing its way to a record quarter. Could more Petronas contracts be coming?
3
4
Koon Yew Yin's Blog
5
BFM Podcast
6
BFM Podcast
7
#
Stock
Score
Daily Stocks
Stock Name
Last
Change
Volume
Stock Name
Last
Change
Volume
Stock Name
Last
Change
Volume
MQ Trading Signals
Stock
Time
Signal
Duration
Stock
Time
Signal
Duration
Featured Advertisers / Partners


Ride The Bull Short The Bear
CS Tan
4.9 / 5.0
This book is the result of the author's many years of experience and observation throughout his 26 years in the stockbroking industry. It was written for general public to learn to invest based on facts and not on fantasies or hearsay....