


Kenanga Research & Investment
Weekly Technical Highlights – Dow Jones Industrial Average (DJIA)

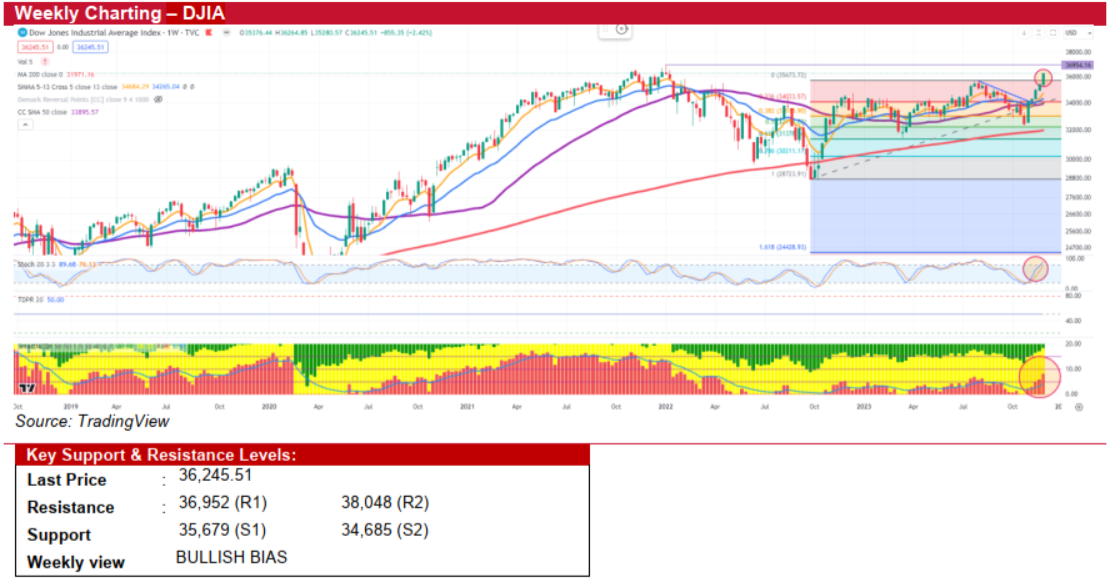
Dow Jones Industrial Average (DJIA) (BULLISH BIAS)
- In November, the US stock market closed on a positive note, driven by optimism stemming from declining inflation, which raised hopes of the Fed discontinuing its interest rate hikes and possibly considering rate cuts in the coming year. Among the major indices, the Nasdaq outperformed the rest with an impressive 10.7% monthly gain, primarily attributed to the strength of the 'Magnificent 7' mega tech stocks. As a result, the Nasdaq's YTD gain reached 36%, marking a significant rebound from its 2022 performance. Additionally, the benchmark S&P 500 and the blue-chip DJIA posted strong performances in November, with gains of 8.4% and 8.8%, bringing their YTD gains to 19% and 8.5%, respectively. This resilience and positive momentum continued into December after the release of the Core PCE data, which showed receding inflation. This data led to the DJIA reaching its highest level for the year.
- Looking forward, historical data suggests that December tends to be a strong month for the stock market, with the benchmark S&P 500 index historically averaging gains of around 1.5% during this period, in contrast to an average gain of approximately 0.8% for other months. However, the rally could wobble if tensions spike after Red Sea attacks. Besides, the stock market rally will also face a pivotal moment at the Fed upcoming policy decision scheduled for Wednesday, December 14.
- Technically, the DJIA's weekly chart shows a sustained upward trend, supported by the Stochastic Oscillator and MCDX's banker chip trending upward. This bullish momentum is likely to continue, potentially testing the record high of 36,952 before the Fed meeting. Any downturn is anticipated to be short-lived and mild, barring significant economic data shifts, escalating conflicts in the Middle East conflict or altered interest rate cut expectations.
- Key resistance levels are identified at 36,952 and 38,048, while immediate support is noted at the previous high of 35,679, with additional support at 34,685 or the 5-week SMA.
Source: Kenanga Research - 4 Dec 2023
More articles on Kenanga Research & Investment
Bond Weekly Outlook - MGS/GII likely to rise amid ongoing US economic resilience
Created by kiasutrader | Nov 22, 2024
Discussions
Be the first to like this. Showing 0 of 0 comments
Post a Comment
Featured Posts


Latest Videos


Apps


Top Articles
1
Good Articles to Share
2
3
Mercury Securities Research
4
Koon Yew Yin's Blog
5
BFM Podcast
6
BFM Podcast
7
#
Stock
Score
Daily Stocks
Stock Name
Last
Change
Volume
Stock Name
Last
Change
Volume
Stock Name
Last
Change
Volume
MQ Trading Signals
Stock
Time
Signal
Duration
Stock
Time
Signal
Duration
Featured Advertisers / Partners


Ride The Bull Short The Bear
CS Tan
4.9 / 5.0
This book is the result of the author's many years of experience and observation throughout his 26 years in the stockbroking industry. It was written for general public to learn to invest based on facts and not on fantasies or hearsay....