


Kenanga Research & Investment
Weekly Technical Highlights – Dow Jones Industrial Average (DJIA)

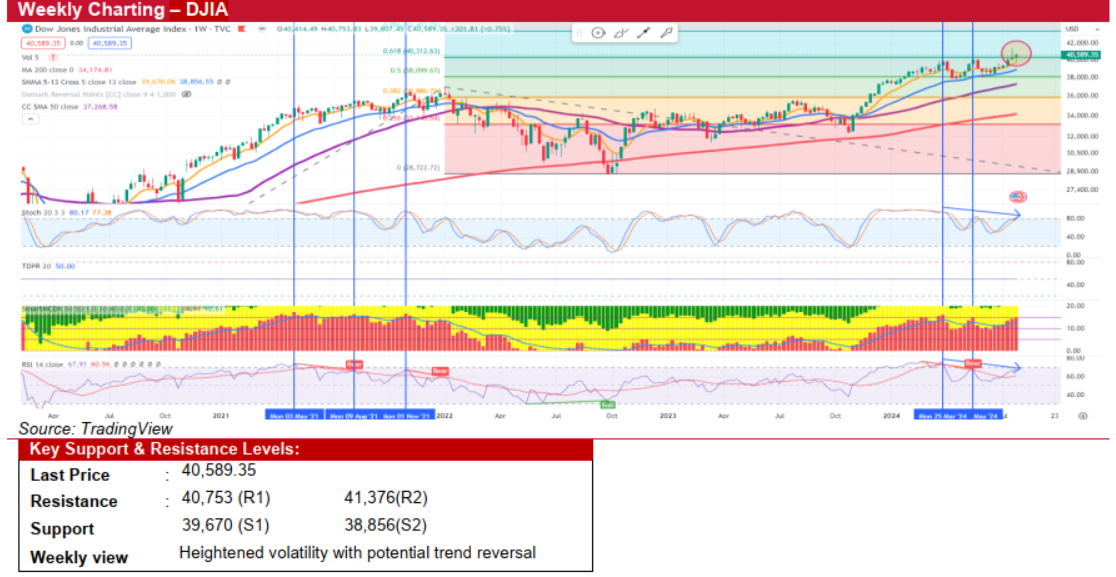
Dow Jones Industrial Average (DJIA)
- The S&P 500 and NASDAQ fell for the second consecutive week amid volatile trading, while the Dow logged its fourth weekly gain, up 0.75% WoW. Modest rallies on Monday and Friday couldn't offset Wednesday's sell-off in the S&P 500 and NASDAQ. The Cboe Volatility Index (VIX) reached near three-month highs at 19.36 before closing the week at 16.38, primarily due to a sell-off in tech stocks. Over the past three weeks, large caps declined by 1.5%, while small caps surged 11.5%. Despite high interest rates and inflation concerns, the U.S. economy gained momentum in 2Q, with GDP growing at 2.8%, exceeding forecasts. Of the first 74 S&P 500 companies that reported quarterly results during this earnings season, 81% beat expectations.
- Moving forward, several potential market-moving catalysts are expected this week. Key quarterly earnings reports include Microsoft and AMD on Tuesday, and Apple and Amazon on Thursday. Additionally, the FOMC and BOJ monetary policy meetings and the monthly US jobs report will influence market direction. The Fed is widely expected to keep interest rates unchanged, and the jobs report will reveal how July's job growth compares to June's surprising gain of 206,000 jobs.
- Technically, the weekly DJIA has formed a ‘hanging man’ candlestick pattern, suggesting a potential reversal in the uptrend. The weekly Stochastic Oscillator and RSI indicators continue to show bearish divergence, indicating a possible trend reversal.
- In short, market volatility is expected to spike this week with several market-moving headlines. While the FOMC meeting is unlikely to bring surprises, the BOJ meeting could add volatility to the Yen carry trade due to rate hike discussions. We anticipate heightened volatility with negative technical readings this week. Immediate support levels are at the 5-week SMA at 39,670, followed by the crucial 13-week SMA at 38,856. Key resistance levels are at 40,753, followed by the recent high of 41,376.
Source: Kenanga Research - 30 Jul 2024
More articles on Kenanga Research & Investment
Actionable Technical Highlights - HUP SENG INDUSTRIES BHD (HUPSENG)
Created by kiasutrader | Nov 20, 2024
Actionable Technical Highlights - FOCUS POINT HOLDINGS BHD (FOCUSP)
Created by kiasutrader | Nov 20, 2024
Discussions
Be the first to like this. Showing 0 of 0 comments
Post a Comment
Featured Posts
Introducing MY's First IPO Fund for Sophisticated Investors!
New Update. Discover investment communities that resonate with your ideas
M & A Value Partners IPO Equity Fund has been launched - Targeted 13% Return p.a
Latest Videos


Apps


Top Articles
1
2
Good Articles to Share
3
4
Koon Yew Yin's Blog
Why all plantation companies will continue to report more profit - Koon Yew Yin
5
AmInvest Research Reports
6
7
save malaysia!
8
#
Stock
Score
Daily Stocks
Stock Name
Last
Change
Volume
Stock Name
Last
Change
Volume
Stock Name
Last
Change
Volume
MQ Trading Signals
Stock
Time
Signal
Duration
Stock
Time
Signal
Duration
Featured Advertisers / Partners


Ride The Bull Short The Bear
CS Tan
4.9 / 5.0
This book is the result of the author's many years of experience and observation throughout his 26 years in the stockbroking industry. It was written for general public to learn to invest based on facts and not on fantasies or hearsay....