WeeklyTechnical Highlights – Dow Jones Industrial Average (DJIA)
kiasutrader
Publish date: Mon, 02 Sep 2024, 05:51 PM
Dow Jones Industrial Average (DJIA)
• The DJIA gained around 1% for the week, surpassing its mid-July record high, while the S&P 500 edged closer to its own record, and the NASDAQ dipped by about 1%. Despite a rough start, the S&P 500 closed August with a 2% gain, marking its ninth positive month in a ten-month period, and the Dow added nearly 2%. The U.S. economy grew faster than initially estimated in 2Q, with GDP revised up to 3%, driven by increased personal spending. The Federal Reserve’s preferred inflation gauge showed easing price pressures, reinforcing expectations of a rate cut at the upcoming September meeting.
• Looking ahead, with little key economic data expected this week aside from Friday’s monthly jobs report, the market is likely to take a breather and consolidate. Recent economic data has reinforced the view of a healthy economy, with the Fed appearing to shift towards a more accommodative stance. However, with most near-term bullish catalysts, including NVIDIA’s earnings, already more or less priced in, the historically weak seasonality in September and the high S&P 500 forward PER of 21x may raise concerns.
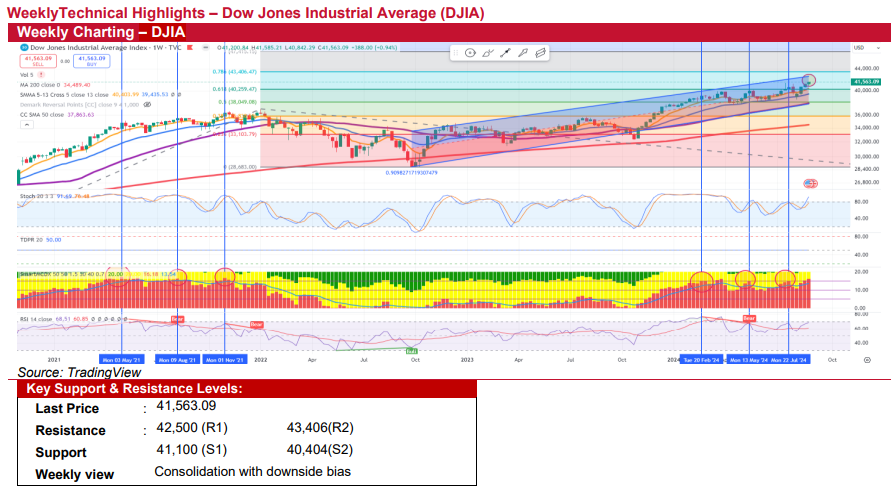
• Technically, the weekly candlestick has formed a hanging man pattern, a potentially bearish reversal signal that requires confirmation from subsequent price action. Divergence in the weekly stochastic and RSI indicators, along with a relatively high MCDX index, also suggests an unfavorable risk-to-reward ratio. This indicates that a short-term pullback is likely on the horizon, as the market appears to have already priced in most expectations.
• All in, we expect the market to enter a consolidation phase with a downward bias this week. Immediate support levels are identified at 41,100, followed by a crucial 40,404, which aligns with the 5-week SMA. On the upside, key resistance levels to watch are at 42,500, followed by 43,406.
Source: Kenanga Research - 2 Sept 2024
More articles on Kenanga Research & Investment
Created by kiasutrader | Nov 22, 2024


