


Lim's Blog
Revenue Group BHD

A pullback simply represents any price movement that is against the prevailing trend. A pullback is a short-term move in the opposite direction of the longer-term trend. It can offer an opportunity to join the trend without chasing the stock.
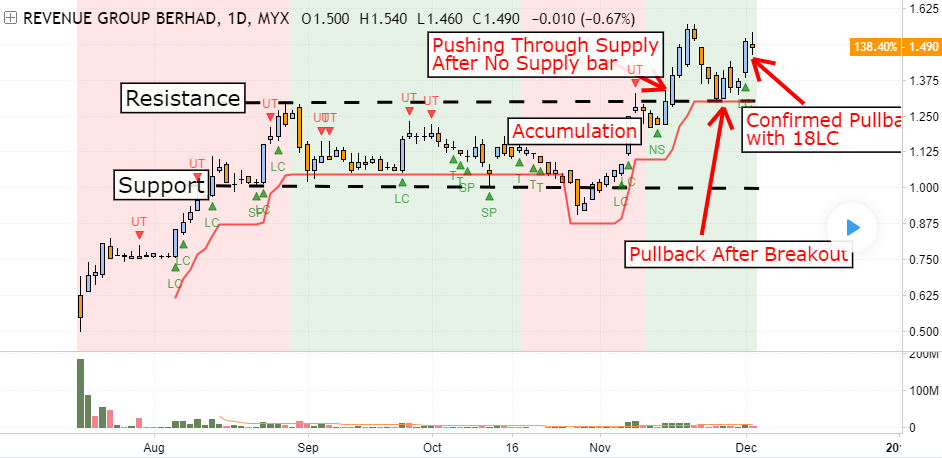
Using Revenue daily chart as example, we have found a pullback trade after the accumulation stage. Based on Volume Spread Analysis, we saw several sign of strengths in the background:
1. 2 months of accumulation stage with a shakeout below support level
2. A confirmation of shakeout with Pushing Through Supply on 16 November 2018
3. Price supported well at previous resistance level on RM1.30
4. A confirmation of pullback signal with a 18 Line Change with volume
Stop Loss = $1.37
1st Target = $1.57
2nd Target = $1.63 or Sign of Weakness
Disclaimer
This information only serves as reference information and does not constitute a buy or sell call. Conduct your own research and assessment before deciding to buy or sell any stock.
Related Stocks
| Chart | Stock Name | Last | Change | Volume |
|---|
More articles on Lim's Blog
Discussions
Be the first to like this. Showing 0 of 0 comments
Post a Comment
Featured Posts


Latest Videos


MQ Trading Signals
Time
Signal
Duration
Type
2025-02-05 12:35:00
ADX
5 Mins
BUY
2025-02-05 11:50:00
EMA 5
10 Mins
BUY
2025-02-05 11:50:00
TURTLE SYSTEM 20
10 Mins
BUY
2025-02-05 11:50:00
EMA 5
5 Mins
BUY
2025-02-05 11:50:00
TURTLE SYSTEM 20
5 Mins
BUY
Apps


Top Articles
1
Stock Market Enthusiast
YTLPower: Hammer + Oversold + Strong Support Level Means Bullish Reversal?
2
CEO Morning Brief
These Big-cap Stocks on Bursa Pay More Than 5% Dividend Yield
3
Mercury Securities Research
4
5
Kenanga Research & Investment
6
RHB Investment Research Reports
7
AmInvest Research Reports
8
M+ Online Research Articles
#
Stock
Score
Daily Stocks
Stock Name
Last
Change
Volume
Stock Name
Last
Change
Volume
Featured Advertisers / Partners


Ride The Bull Short The Bear
CS Tan
4.9 / 5.0
This book is the result of the author's many years of experience and observation throughout his 26 years in the stockbroking industry. It was written for general public to learn to invest based on facts and not on fantasies or hearsay....