Lim's Blog
IJM & GAMUDA
LimKL1
Publish date: Sun, 20 Jan 2019, 10:31 PM
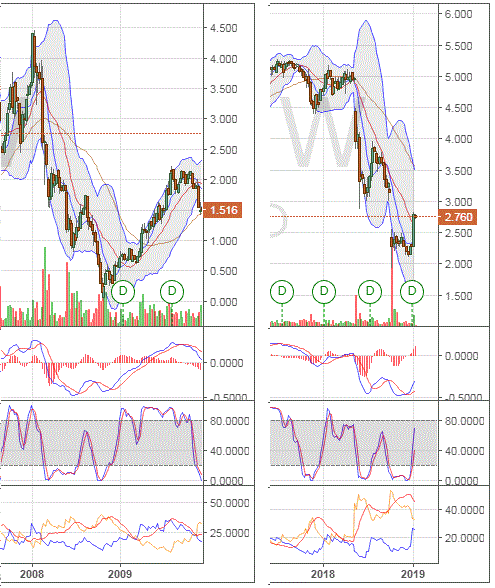
When you compare the charts of IJM and GAMUDA last 12 months with the charts for 2008-2009, the similarity is pretty uncanny. It looks like both stocks are tracing out their bottoms. Take a look at the MACD and ADX indicators.

Chart 1: IJM's monthly charts for 2007-2009 & 2017-2019

Chart 2: Gamuda's monthly charts for 2008-2009 & 2018-2019
I think that it may be a good time to nibble into these 2 construction stocks.
More articles on Lim's Blog
Discussions
Be the first to like this. Showing 0 of 0 comments


