Eco World Development (8206) - New All-time High?
MercurySec
Publish date: Wed, 31 Jul 2024, 09:19 AM
Technical Highlights
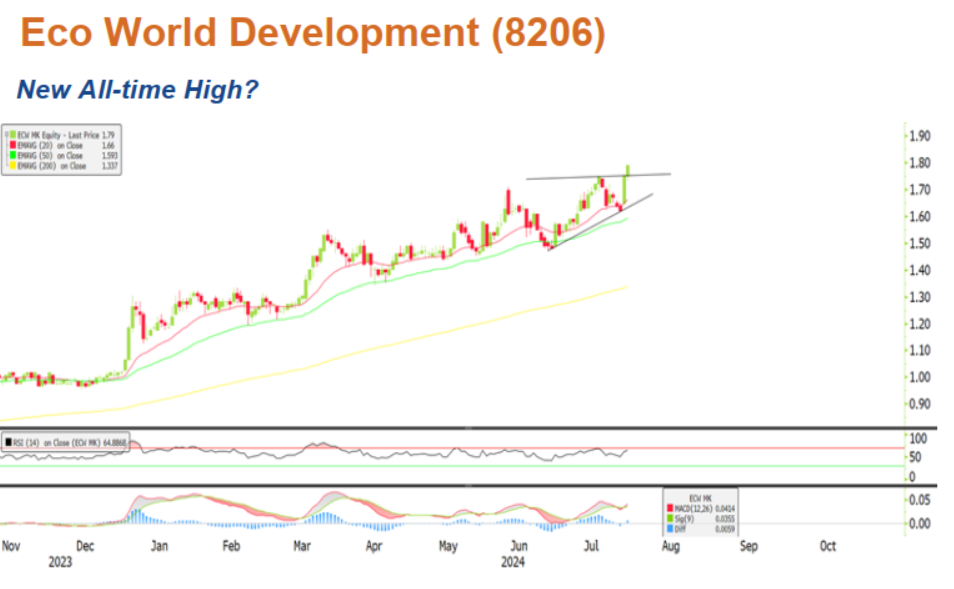
After a period of consolidation from its 52-week high, a large green candle formed two days ago, sending the stock to trade above all its EMA lines. Momentum was still keeping up, especially with the formation of another green candle at closing yesterday, breaking through the 4-week-long pennant pattern with substantial trading volume (2.3x more than its average 90-day trading volume). With these indicators showing positive signals, we think that upswing potential may still be in play.
The upward-pointing MACD line attempting to cross above the signal line signifies that momentum is improving. Similarly, the upward-pointing 20-EMA line confirms the short-term bullishness.
With the pattern break-out accompanied by momentum, we think the stock could potentially test the resistance at RM1.93 (new all-time high) first and subsequently at RM2.11 (determined by the difference of RM0.180 between the high and low of the pennant pattern). Conversely, a dip below RM1.62 could signify the start of a correction phase.
Entry – RM-1.79 – RM1.82
Stop Loss – RM1.52
Target Price – RM1.93 – RM2.11
Source: Mercury Securities Research - 31 Jul 2024
Related Stocks
| Chart | Stock Name | Last | Change | Volume |
|---|
More articles on Mercury Securities Research
Created by MercurySec | Jan 22, 2025


