VS Industry (6963) Multiple Positive Signals in Play
MercurySec
Publish date: Mon, 23 Sep 2024, 09:15 AM
Technical Highlights
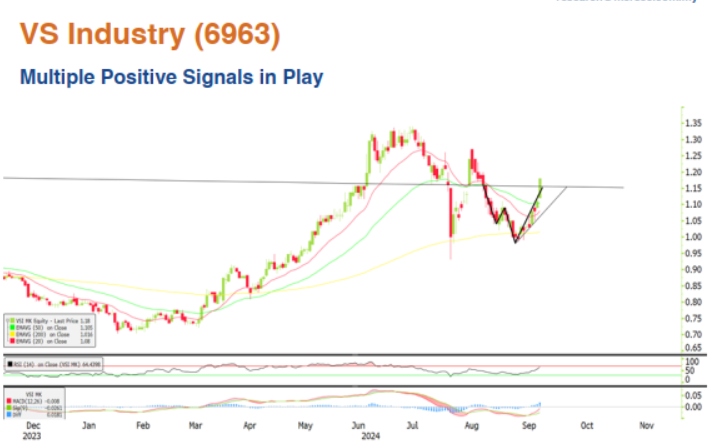
The stock initially rebounded strongly after experiencing a period of consolidation from its 52-week high. However, it lost momentum and reversed direction, falling sharply. Recently, it started to recover and closed with an uptrend pattern. Last Friday, a Marubozu candle was formed as the stock successfully broke through both the crucial RM1.16 resistance level (extended from the recent sell-off point) and the pennant pattern break-out indication level. This indicates a strong and supportive uptrend pattern. Furthermore, the breakout pattern confirms the uptrend signal, as it is accompanied by the classic W pattern. Momentum indicators are positive. This is evident from the continued acceleration of the RSI reading and the recent occurrence of a golden cross in the MACD indicator for the stock. As for the short-term bullishness, it is ascertained by the stock trading above all its EMA lines recently and sharp upward-pointing 20-EMA line. With the uptrend pattern accompanied by multiple positive indicators, we think the stock can put its first resistance level of RM1.24 to the test. Attempting the next resistance level at RM1.33 (52-week high) will be the next target if technical indicators remain strong after a successful breakout of the first resistance. Conversely, if the stock falls back to RM1.08 (recent low), this could signal a false come-back.
Entry – RM1.15 – RM1.18
Stop Loss – RM0.98
Target Price – RM1.24 – RM1.33
Source: Mercury Securities Research - 23 Sep 2024
Related Stocks
| Chart | Stock Name | Last | Change | Volume |
|---|
More articles on Mercury Securities Research
Created by MercurySec | Jan 17, 2025


