TDM Berhad (2054) - Approaching Key Levels
MercurySec
Publish date: Thu, 03 Oct 2024, 07:53 PM

Technical Highlights
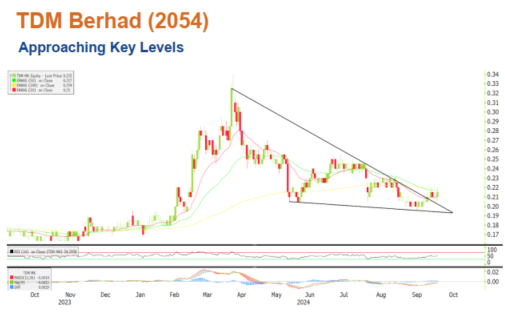
The stock has been on an upward trend since January 2024 but experienced a downtrend from March to September, forming a bullish falling wedge. Last week, it broke out of this pattern and completed a successful pullback, setting the stage for a strong move. Yesterday, the stock surged 7% with rising buying volume and is now testing the 20-day and 200-day EMAs. A breakout above these levels could signal a significant upward push.
Momentum indicators are flashing green, with the RSI at 54 and trending upward, showing renewed buying interest. The MACD is also moving higher, further supported by the increasing buying volume.
An entry point lies between RM0.210 and RM0.220. The first resistance to watch is RM0.230, with the potential to reach RM0.255 if it breaks through. A successful move past this point could even challenge near the 52-week high. On the downside, a fall below RM0.195 could indicate a false breakout, leading to a correction towards RM0.160, which has previously acted as a strong consolidation zone.
Entry – RM0.210 – RM0.220
Stop Loss – RM0.195
Target Price – RM0.230 – RM0.255
Source: Mercury Research - 3 Oct 2024
Related Stocks
| Chart | Stock Name | Last | Change | Volume |
|---|
More articles on Mercury Securities Research
Created by MercurySec | Jan 17, 2025


