


Mercury Securities Research
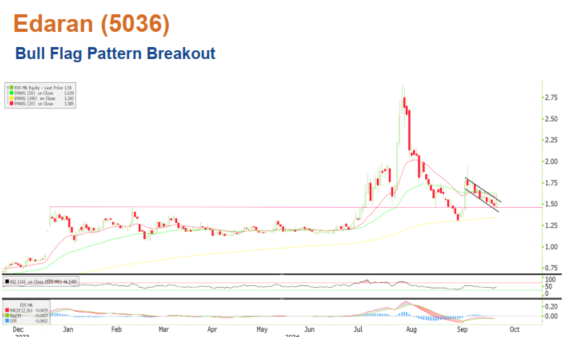
Edaran (5036) - Bull Flag Pattern Breakout

MercurySec
Publish date: Mon, 07 Oct 2024, 07:54 PM
MercurySec
0 435
An official blog in i3investor to publish research reports provided by Mercury Securities Research team.
All materials published here are prepared by Mercury Securities Sdn. Bhd.
Mercury Securities Sdn. Bhd.
L-7-2, No.2, Jalan Solaris,
Solaris Mont Kiara, 50480, Kuala Lumpur
Tel: 603-6203 7227
Email: mercurykl@mersec.com.my
All materials published here are prepared by Mercury Securities Sdn. Bhd.
Mercury Securities Sdn. Bhd.
L-7-2, No.2, Jalan Solaris,
Solaris Mont Kiara, 50480, Kuala Lumpur
Tel: 603-6203 7227
Email: mercurykl@mersec.com.my
Technical Highlights
Since the beginning of 2024, the stock has been consolidating for seven months until July. It then surged by over 100% in August, establishing a strong uptrend. Recently, it has continued the upward momentum, but saw a pullback in September, forming a bullish flag pattern. Last week, the stock broke out of the bullish flag but is currently facing resistance at the 50-day and 20-day EMAs. It's still staying above the 200-day EMA, supporting a long-term bullish outlook.
Momentum indicators are showing signs of improvement. The RSI is currently at 47, and after a month of neutral movement, it's trending upward. Although the MACD is moving in a neutral manner, it still hasn’t shown any signs of turning downward, indicating stability.
The entry point would be between RM1.50 to RM1.60. If the bull flag breakout holds, it could target the first resistance at RM1.73. A successful break above that could push it toward the second resistance at RM1.96. On the flip side, strong support lies at RM1.46, a key level that acted as resistance during the seven-month consolidation in June, which has now flipped to support.
Entry – RM1.50 – RM1.60
Stop Loss – RM1.38
Target Price – RM1.73 – RM1.96
Source: Mercury Research - 7 Oct 2024
Related Stocks
| Chart | Stock Name | Last | Change | Volume |
|---|
More articles on Mercury Securities Research
Discussions
Be the first to like this. Showing 0 of 0 comments
Post a Comment
Featured Posts
Introducing MY's First IPO Fund for Sophisticated Investors!
New Update. Discover investment communities that resonate with your ideas
M & A Value Partners IPO Equity Fund has been launched - Targeted 13% Return p.a
Latest Videos


Apps


Top Articles
1
Stock Market Enthusiast
Top 3 AI/Data Center Newsflow for the 3rd Week of December - #TENAGA, #YTL, #YTLPOWER
2
save malaysia!
3
Good Articles to Share
4
Good Articles to Share
5
Good Articles to Share
Gaza ceasefire deal 'closer than ever', says Hamas and two allies
6
Good Articles to Share
Ryan Serhant makes bold pitch to fix the housing ‘affordability crisis’
7
Good Articles to Share
8
#
Stock
Score
Daily Stocks
Stock Name
Last
Change
Volume
Stock Name
Last
Change
Volume
Stock Name
Last
Change
Volume
Featured Advertisers / Partners


Ride The Bull Short The Bear
CS Tan
4.9 / 5.0
This book is the result of the author's many years of experience and observation throughout his 26 years in the stockbroking industry. It was written for general public to learn to invest based on facts and not on fantasies or hearsay....