Turiya (4359) - Testing Key EMAs
MercurySec
Publish date: Fri, 20 Dec 2024, 08:31 AM

Technical Highlights
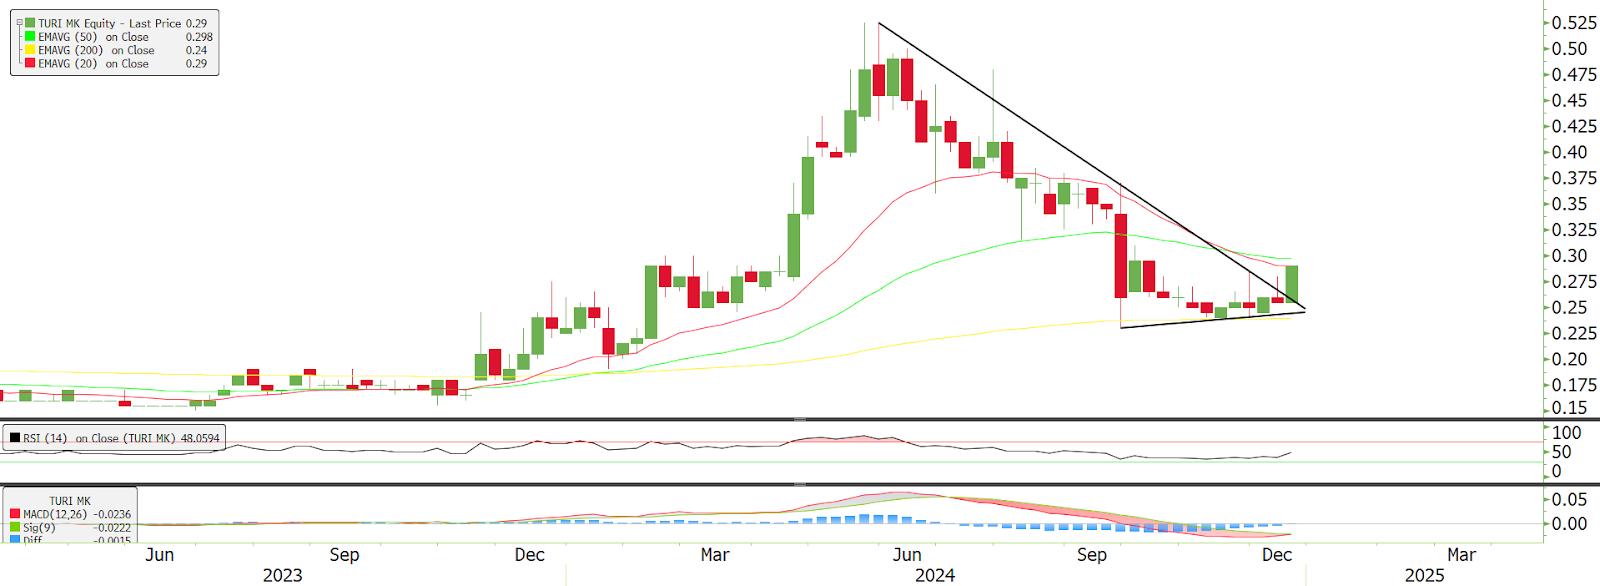
The stock experienced a strong bull market in 2023, peaking in May 2024 before entering a downward phase. Over the past four months, it tested the 200-day EMA and began rebounding earlier this month. The stock now broke out of its downtrend line with noticeable volume and is now approaching key resistance levels at the 20- and 50-day EMAs.
Momentum indicators show positive signals. After months of neutral movement, the RSI has started to trend upward, currently sitting at 45. Additionally, the MACD has formed a golden cross this week, reinforcing the stock's bullish potential.
An ideal entry point would be a pullback to the RM0.265-RM0.275 range. The first resistance is at RM0.295, with a successful breakout potentially driving the stock toward RM0.340. Sustained buying pressure could push it further to RM0.380. On the downside, if the stock drops below RM0.240, it may indicate a continuation of the downtrend with the potential to hit a new 52-week low. This setup offers an attractive risk-to-reward ratio of 3.
Entry - RM0.265 - RM0.275
Stop Loss - RM0.240
Target Price - RM0.295 - RM0.340 - RM0.380
Source: Mercury Securities Research - 20 Dec 2024
Related Stocks
| Chart | Stock Name | Last | Change | Volume |
|---|
Market Buzz
More articles on Mercury Securities Research
Created by MercurySec | Jan 17, 2025


