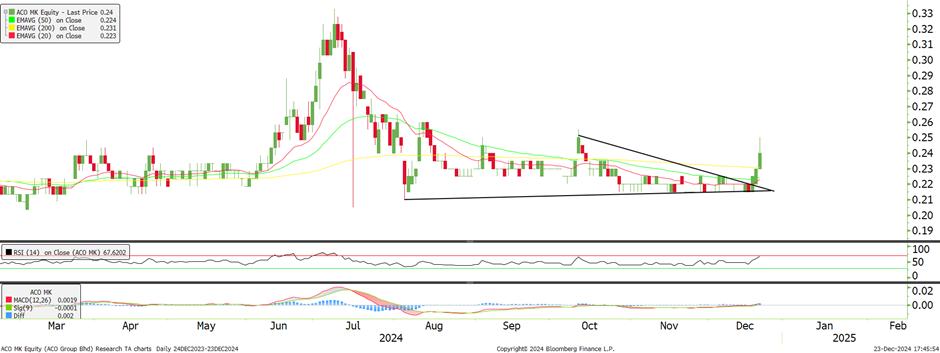
ACO Group (0218) - Triangle Breakout with Momentum
MercurySec
Publish date: Tue, 24 Dec 2024, 08:32 AM

Technical Highlights
After reaching its 52-week high in mid-Jun, the stock fell into a consolidation phase. During this period, the stock showed some signs of recovery but failed to sustain momentum as trading strength remained muted. Recently, however, the stock regained momentum and began to trend upward. This strong momentum continued to push the stock higher and triggered a triangle pattern breakout. Following the pattern breakout, the stock maintained its upward movement and finally traded above all its EMA lines.
Momentum indicators are showing strength. The RSI regained strength and trended sharply upward towards the overbought territory, indicating trading interest is accumulating. Additionally, the stock's bullish momentum is ascertained by the recent exhibition of golden cross in the MACD.
Waiting pullback to the range between RM0.23 and RM0.24 would offer a good entry opportunity. The first resistance lies on RM0.250, and a breakout above this level could see the stock rally toward RM0.31. Conversely, a drop below RM0.210 could signal a continuation of the downtrend, with the potential to test new 52-week lows at RM0.180.
Entry - RM0.230 - RM0.240
Stop Loss - RM0.190
Target Price - RM0.250 - RM0.310
Source: Mercury Securities Research - 24 Dec 2024
Related Stocks
| Chart | Stock Name | Last | Change | Volume |
|---|
More articles on Mercury Securities Research
Created by MercurySec | Jan 22, 2025


