


MQ Trader System
Technical Analysis - Eversendai Corporation (SENDAI)

Some traders provided feedback to ask for more examples on performing Technical Analysis on stocks on the MQ Trader system. So today we will pick the stock SENDAI for illustration purpose.
Users who have signed up for any package (Free Trial or Sponsored package) of the MQ Trader system can select the stock from the side bar on the left, or type in the stock code SENDAI in the search box.
The first page you'll see is the large stock chart with Bollinger band drawn on top of the Candlestick price chart.
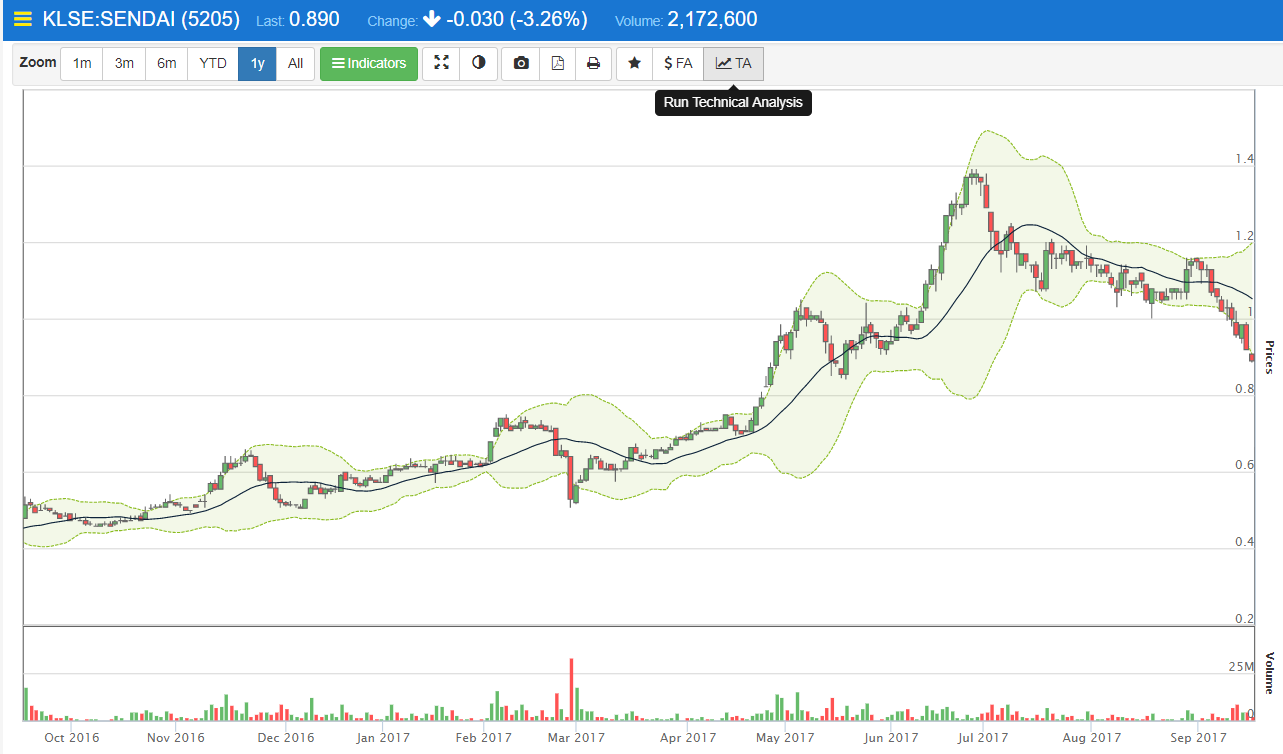
Traders can also select other common Technical Indicators to show on the price chart by click on the green Indicators button at the button bar just above the candlestick chart. SMA and EMA lines will be drawn in the same area as the price chart, while the indicators (e.g. RSI, MACD, ADX) will be drawn in the area below the price chart.
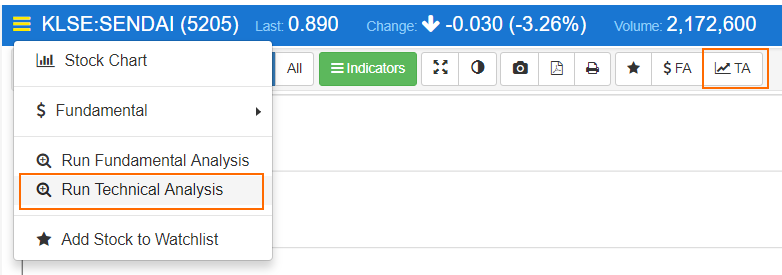
Next, traders may like to perform a quick Technical on the stock. Just click on the Stock name or the 3-line "hamburger bar" to the left of the stock name to pull out the option menu for this stock. The Run Technical Analysis function will be presented in the menu, as per the image below. Alternatively, traders can also click on the "TA" button in the toolbar which will go directly to the Technical Analysis function for this stock.
Technical Analysis
SENDAI scores an overall Technical Rating of just 1.1 over 5 as at 19-Sep-2017. It has 0 Bullish ratings, 5 Bearish ratings and 2 Neutral ratings. This is rather poor, and is certainly reflected by the latest price moment of this stock where a price correction is observed since July this year.
The technical ratings are calculated on fly for the most recent stock price with only 15 minutes delayed from the live stock price.
Below is the screen capture of the Technical Analysis page. Traders can click on the (i) icon beside the name of each rating to read about how is each rating calculated. Traders can also click on the "View Chart" link to see the indicators

Based on the Technical Rating above, this is definitely a stock to avoid. Certain traders may argue that there may be a chance for "Bottom-Fishing" on this stock since the price has been depressed for so long. A bottom-fishing investor speculates that the stock's depressed price is temporary, will recover and make for a profitable investment. However, traders are advised to be careful as bottom fishing is a risky strategy because the company's stock price is depressed for a reason and may not bounce back.
Conclusion
As you can see from the simple steps above, traders and investors can perform a very quick Technical Analysis on stock as of the latest date and price before deciding to trade any stock in the stock market. The analysis uses the most common criteria for Technical analysis, which are also commonly being used by many professional traders and investors.
In general, an overall Technical rating of 4 and above signifies the stock is in a Bullish trend, whereas Technical rating of below 2 signifies Bearish trend.
There are other data and information that you can see relating to a stock from the MQ Trader system. We shall cover those other features or info in the future. For now, we encourage you to explore and review those functions yourself by signing up for the Free Trial package.
Traders who are interested to read about how to perform Fundamental Analsis on a company can refer to our previous article: Fundamental Friday - Fundamental Analysis on Public Bank
Community Feedback
We encourage traders to try out and evaluate the MQ Trader system and provide us feedback on the features you like to see in the system. We have received many positive feedback so far, and we are currently compiling and reviewing them for possible inclusion into the next release of the system.
We would like to develop this sytem based on community feedback to cater for community needs. Thanks to all those who have provided valuable feedback to us. Keep those feedback coming in!
Disclaimer
This article does not represent a BUY or SELL recommendation on the stock covered. Traders and Investors are encouraged to do their own analysis on stocks instead of blindly following any Trading calls raised by various parties in the Internet. We may or may not hold position in the stock covered, or initiate new position in the stock within the next 7 days.
Related Stocks
| Chart | Stock Name | Last | Change | Volume |
|---|
More articles on MQ Trader System
[MQ Trader] Fundamental Friday - Fundamental Analysis on Public Bank
Created by MQ Trader | Sep 15, 2017
[MQ Trader] VS Fundamental Analysis: Potential to Make More Money This Year Compare to Last Year?
Created by MQ Trader | Sep 14, 2017
Discussions
Be the first to like this. Showing 8 of 8 comments
It is impossible for such normal analysis article to become No.1 in top 5 viewed article, fake ranking
2017-09-19 18:42
Anyone can just sponsore & pay i3 to rank No.1 to promote the service or product?
2017-09-19 18:43
lol, now who dont know this is a downtrend stock ?
if you post this when sendai at 1.0 still different
2017-09-20 07:46
Yup, you don't need software to tell you the stock is bearish or oversold... In the end, it's still your own call. May be for the very lazy and totally have no sense in share investment. haha..
2017-09-20 07:51
Post a Comment
Featured Posts


Latest Videos


Apps


Top Articles
1
Good Articles to Share
2
3
Koon Yew Yin's Blog
Why all plantation companies will continue to report more profit - Koon Yew Yin
4
5
save malaysia!
6
7
#
Stock
Score
Daily Stocks
Stock Name
Last
Change
Volume
Stock Name
Last
Change
Volume
Featured Advertisers / Partners


Ride The Bull Short The Bear
CS Tan
4.9 / 5.0
This book is the result of the author's many years of experience and observation throughout his 26 years in the stockbroking industry. It was written for general public to learn to invest based on facts and not on fantasies or hearsay....
einvest88
0.75?
2017-09-19 10:02